Fig. 4
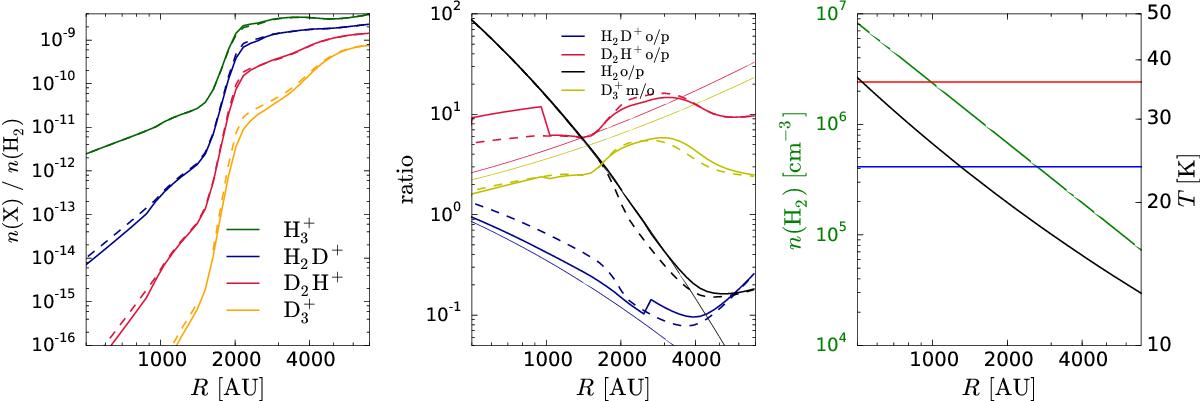
Left: radial distributions of the fractional abundances of selected species at t = 5 × 10⁵ yr in a protostellar core resembling IRAS 16293 according to the model of Crimier et al. (2010). Solid lines correspond to the species-to-species model (method 1), while dashed lines correspond to the ground-state-to-species model. Middle: radial distributions of the o/p ratios of selected species, and the meta/ortho ratio of ![]() . The thin solid lines show the thermal spin-state ratios of the plotted species. Right: density and temperature distributions of the IRAS 16293 core model. The blue and red horizontal lines mark the critical densities of the first excited rotational transitions of oH2D+ and pD2H+, respectively.
. The thin solid lines show the thermal spin-state ratios of the plotted species. Right: density and temperature distributions of the IRAS 16293 core model. The blue and red horizontal lines mark the critical densities of the first excited rotational transitions of oH2D+ and pD2H+, respectively.
Current usage metrics show cumulative count of Article Views (full-text article views including HTML views, PDF and ePub downloads, according to the available data) and Abstracts Views on Vision4Press platform.
Data correspond to usage on the plateform after 2015. The current usage metrics is available 48-96 hours after online publication and is updated daily on week days.
Initial download of the metrics may take a while.