Fig. 1
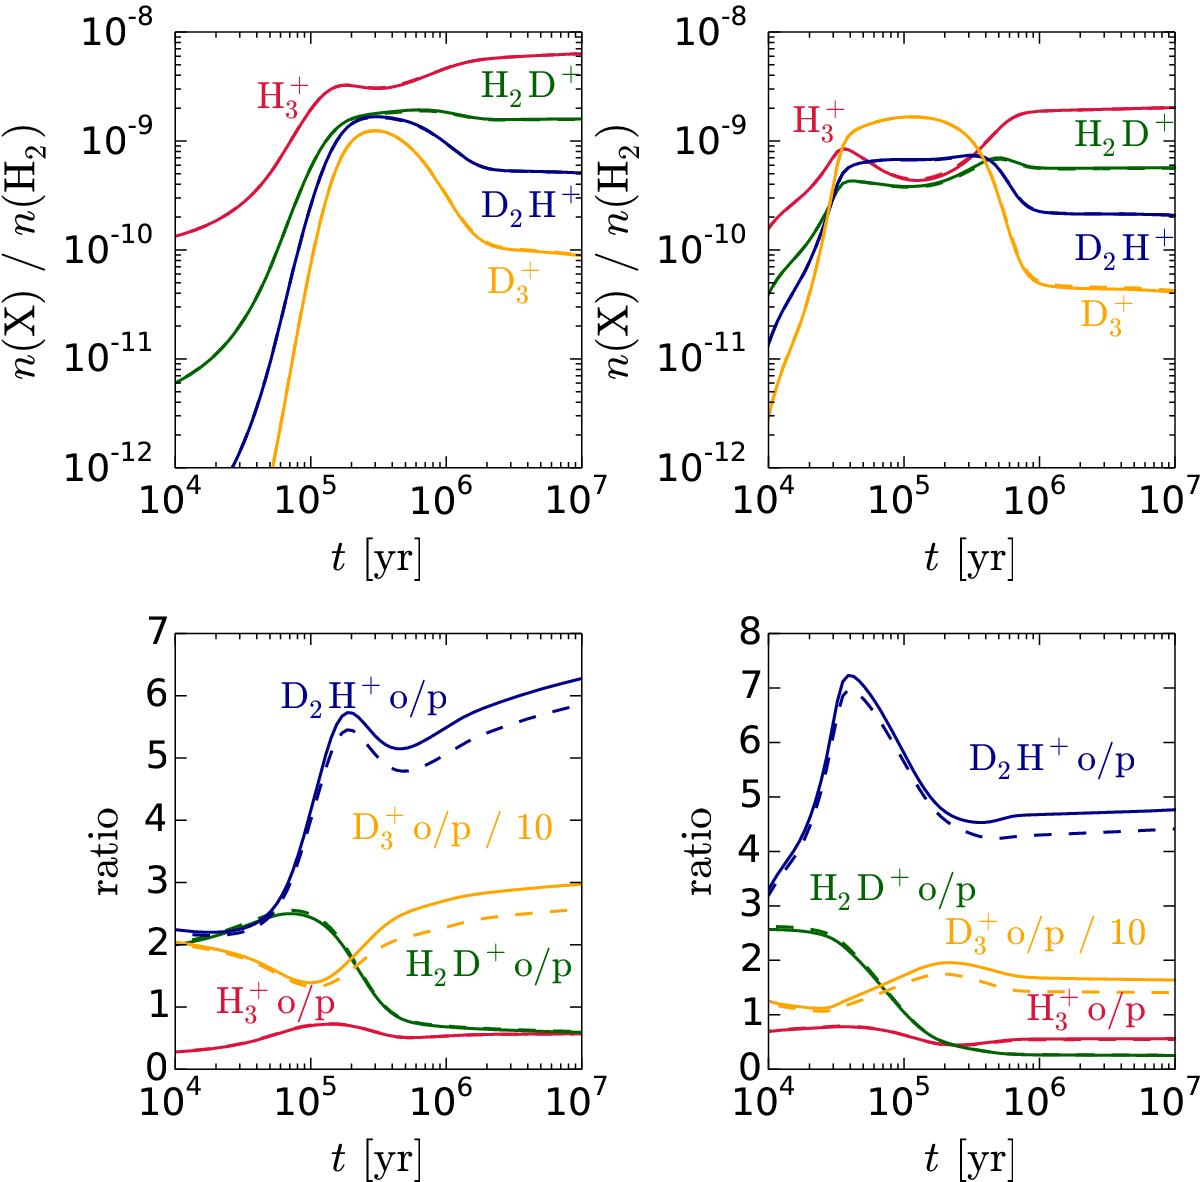
Abundances (upper row) and abundance ratios (lower row) of the various ![]() isotopologs as functions of time. The left-hand panels correspond to n(H2) = 105 cm-3, while the right-hand panels correspond to n(H2) = 106 cm-3. The temperature is set to Tgas = Tdust = 10 K. Solid lines represent calculations using the Hugo et al. (2009) ground-state-to-species rate coefficients, while dashed lines represent calculations using our new fit to the same coefficients (see text).
isotopologs as functions of time. The left-hand panels correspond to n(H2) = 105 cm-3, while the right-hand panels correspond to n(H2) = 106 cm-3. The temperature is set to Tgas = Tdust = 10 K. Solid lines represent calculations using the Hugo et al. (2009) ground-state-to-species rate coefficients, while dashed lines represent calculations using our new fit to the same coefficients (see text).
Current usage metrics show cumulative count of Article Views (full-text article views including HTML views, PDF and ePub downloads, according to the available data) and Abstracts Views on Vision4Press platform.
Data correspond to usage on the plateform after 2015. The current usage metrics is available 48-96 hours after online publication and is updated daily on week days.
Initial download of the metrics may take a while.