Free Access
Fig. B.1
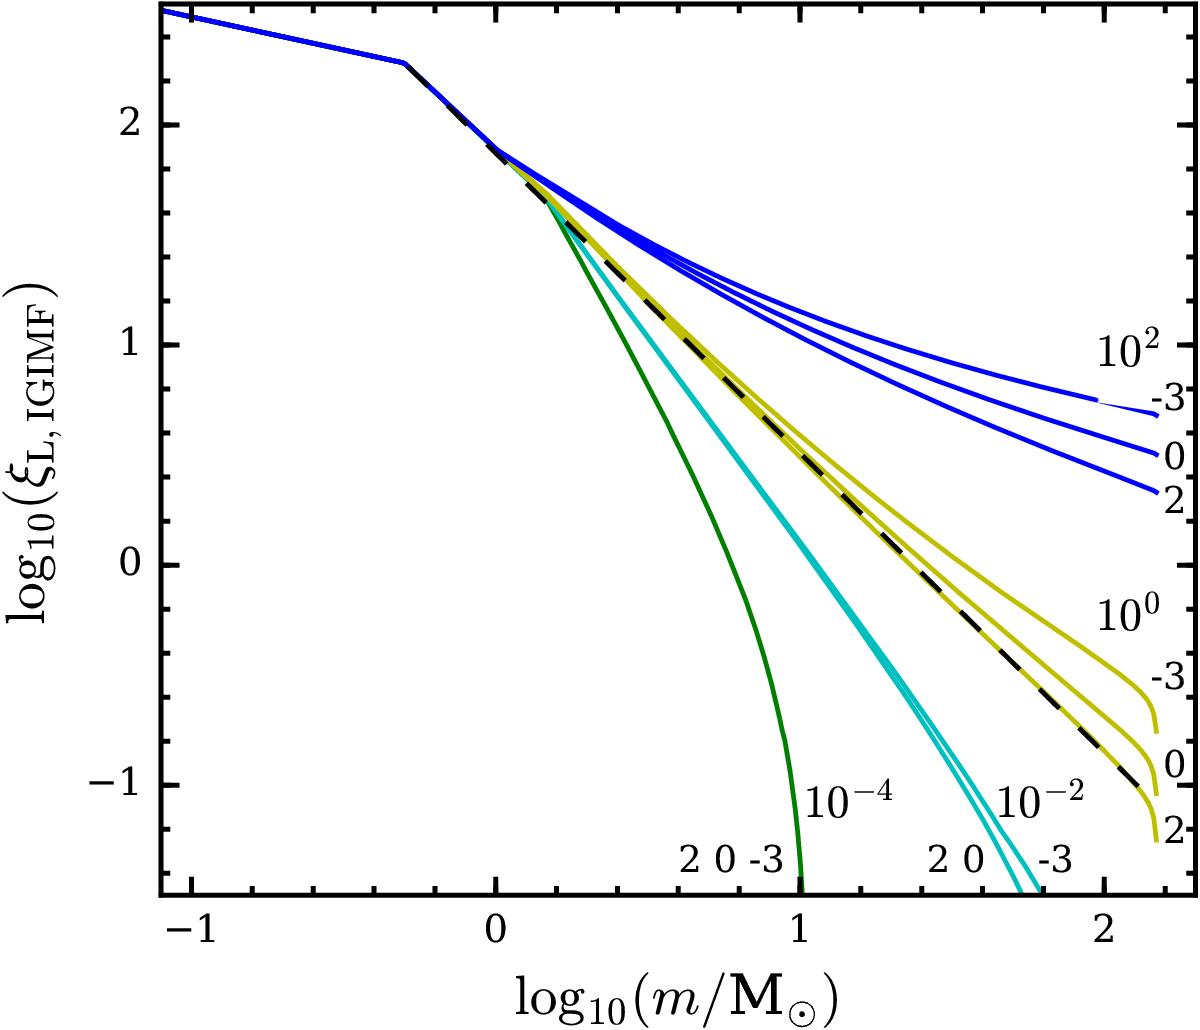
Same as Fig. 3 but using Eq. (8), with green, cyan, yellow, and blue lines for SFR = 10-4, 10-2, 100, and 102M⊙/yr, respectively. There are three cases for each color with [Fe/H] = –3, 0, and 2 from upper to lower lines labeled in the plot, however, the three green lines overlap and the lower two cyan lines also overlap.
Current usage metrics show cumulative count of Article Views (full-text article views including HTML views, PDF and ePub downloads, according to the available data) and Abstracts Views on Vision4Press platform.
Data correspond to usage on the plateform after 2015. The current usage metrics is available 48-96 hours after online publication and is updated daily on week days.
Initial download of the metrics may take a while.