Fig. 5
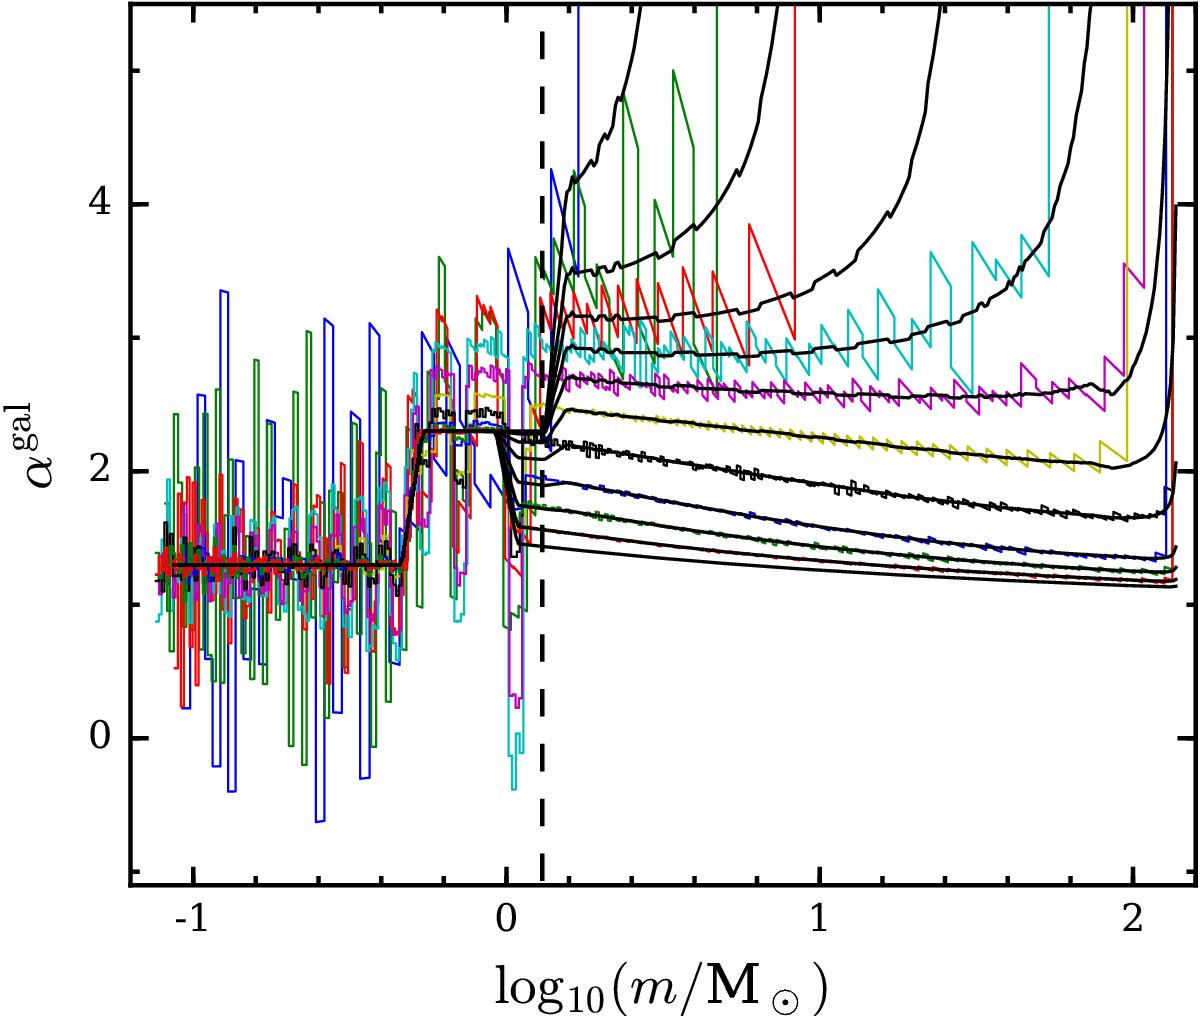
Galaxy-wide IMF power-law index, αgal (Eq. (15)), for OSGIMF (colored thin lines) and IGIMF (black lines) for SFR = 10-5, 10-4 ... 105M⊙/yr from upper to lower lines. For the SFR = 105M⊙/yr case, only the IGIMF index is plotted because a star-by-star sampling costs too much computational time. Below 1 M⊙, the plot reproduces the canonical IMF indexes of 1.3 and 2.3 as defined in Eq. (2). Between 1 and 1.1 M⊙, αgal follows the variable α3 defined in Eq. (5). At higher masses, αgal varies with SFR. The OSGIMF index deviates from the IGIMF index at roughly 1 M⊙. This result may lead to a large observational scatter at intermediate and high mass ranges. The large αgal scatter for the OSGIMF at the low mass end and low SFR has been explained in the text for Fig. 4. The vertical dashed line at m = 1.3M⊙ divides the IGIMF into two parts as mentioned in Sect. 5.1.
Current usage metrics show cumulative count of Article Views (full-text article views including HTML views, PDF and ePub downloads, according to the available data) and Abstracts Views on Vision4Press platform.
Data correspond to usage on the plateform after 2015. The current usage metrics is available 48-96 hours after online publication and is updated daily on week days.
Initial download of the metrics may take a while.