Fig. 4
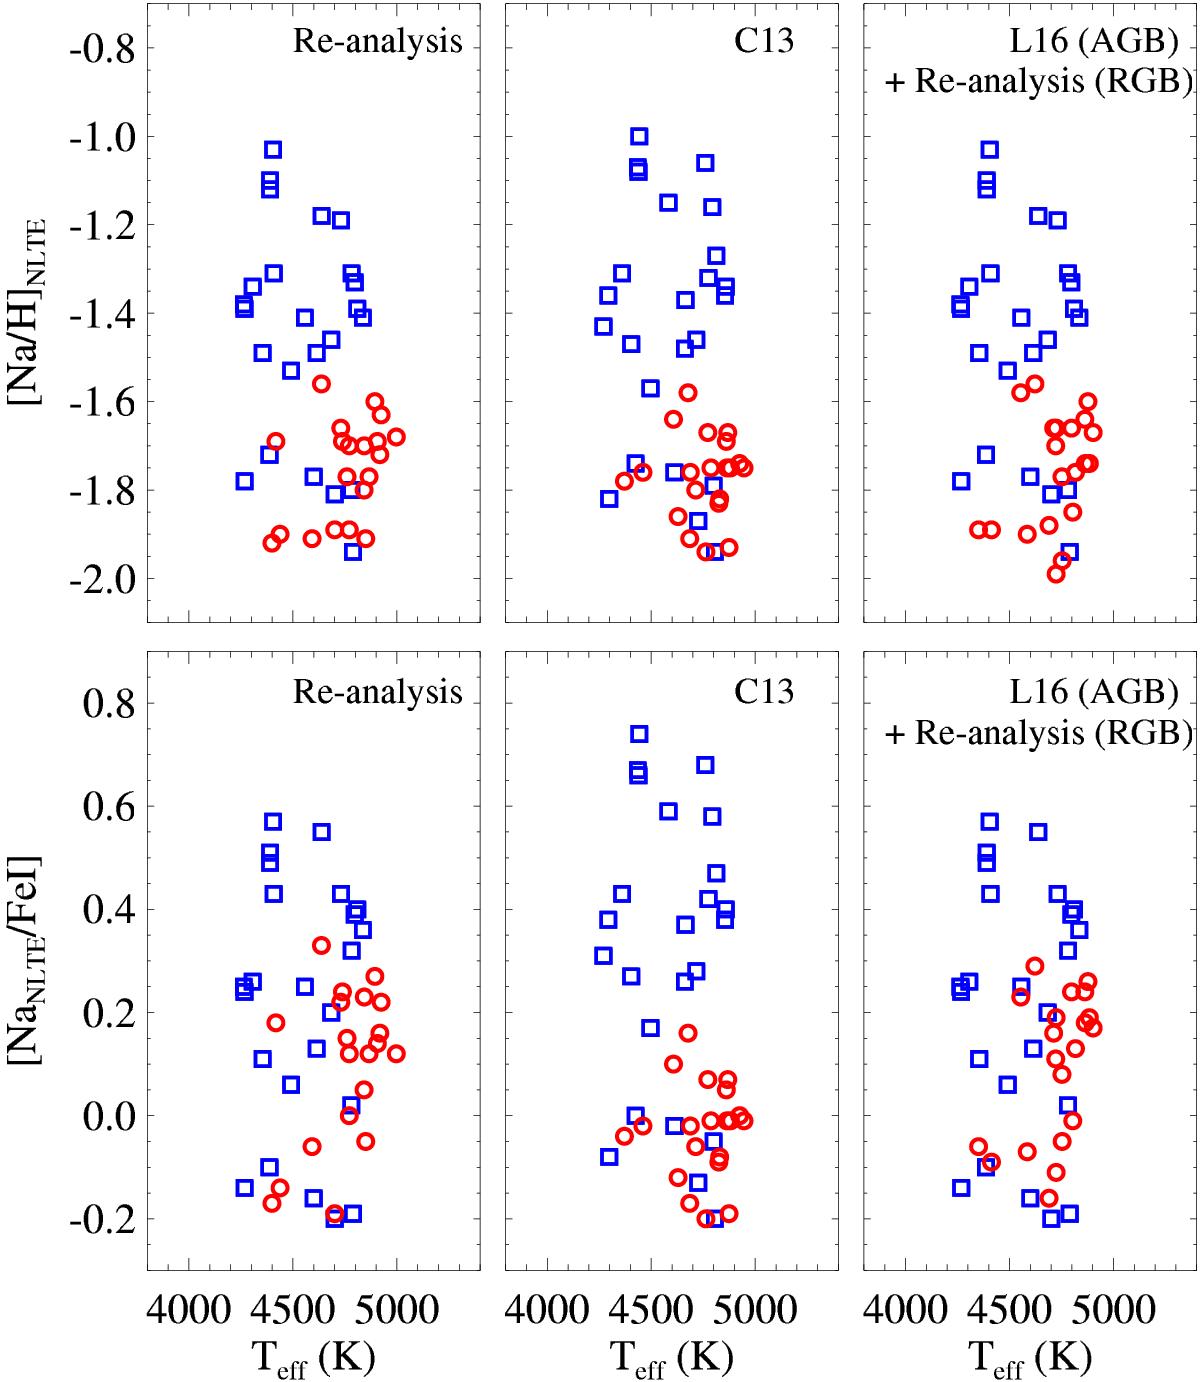
Na abundance (NLTE) distributions of the sample of C13 in NGC 6752. The left-column panels show our re-analysis results, middle-column panels show the Na abundance distribution from C13, and the right-column panels show the Na abundance of the AGB sample derived by Lapenna et al. (2016) together with the RGB stars from our re-analysis. For convenience of comparison, the data from C13 and Lapenna et al. (2016) are shifted systematically to our scale with a constant which is equal to the mean difference between their results and ours, while the dispersions derived in each study are kept. Red circles and blue squares represent AGB and RGB stars, respectively.
Current usage metrics show cumulative count of Article Views (full-text article views including HTML views, PDF and ePub downloads, according to the available data) and Abstracts Views on Vision4Press platform.
Data correspond to usage on the plateform after 2015. The current usage metrics is available 48-96 hours after online publication and is updated daily on week days.
Initial download of the metrics may take a while.