Free Access
Fig. 1
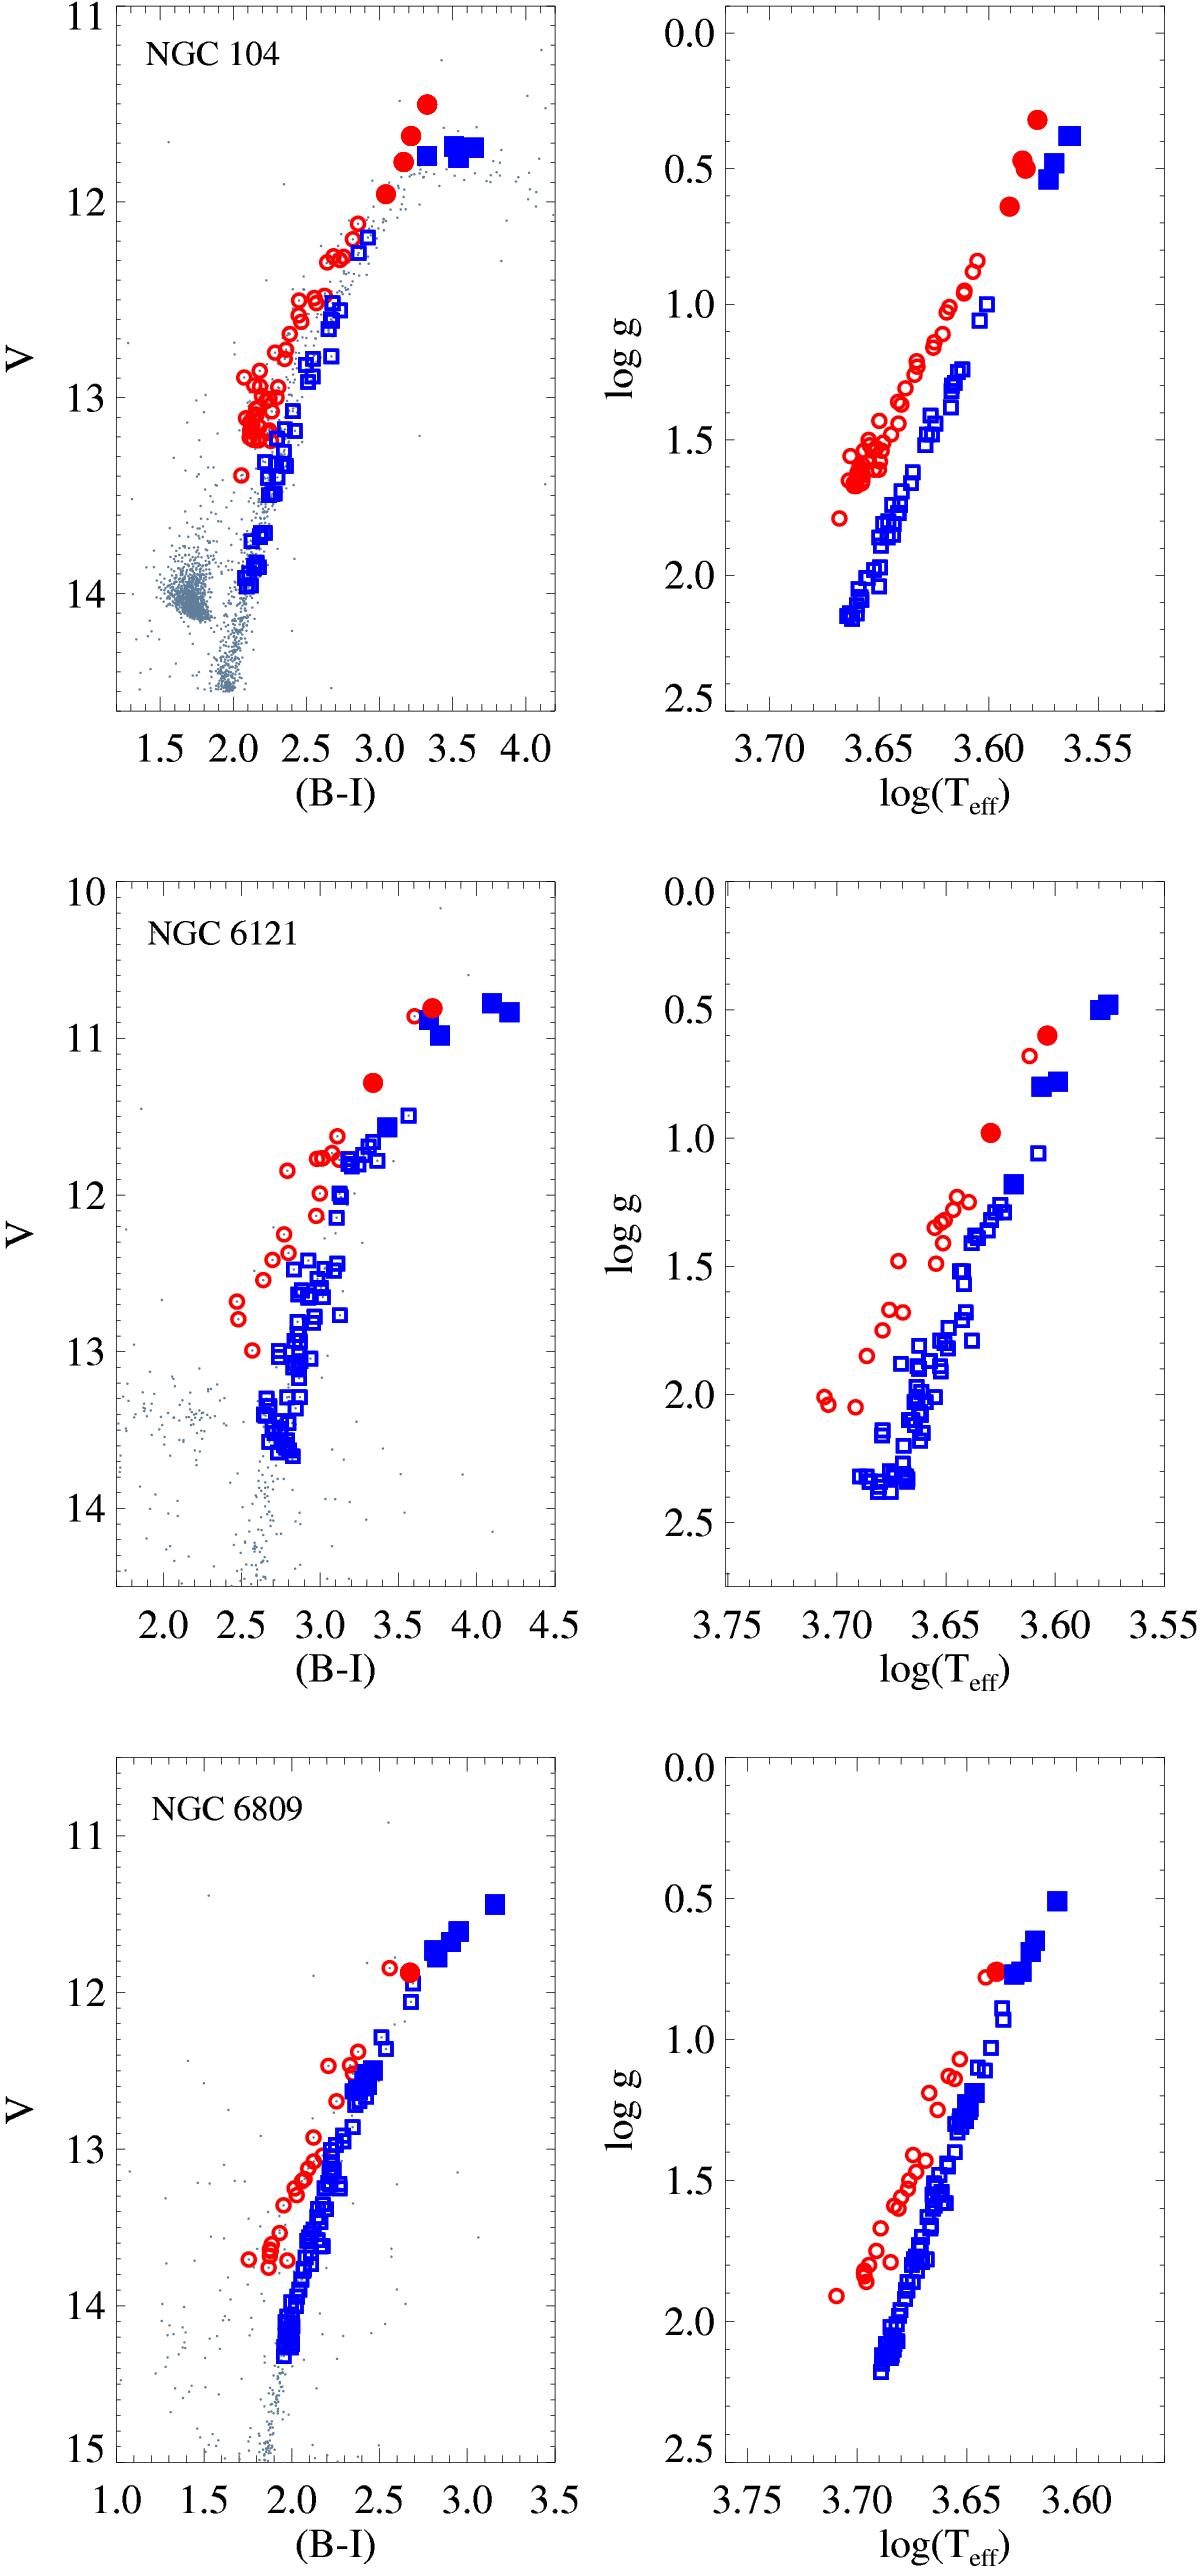
Photometric CMDs (left) and log g−log Teff distributions (right) of the cluster member stars. Red circles and blue squares represent AGB and RGB stars, respectively, while the GIRAFFE and UVES samples can be distinguished by open and filled symbols, respectively. The same symbols are used throughout the paper.
This figure is made of several images, please see below:
Current usage metrics show cumulative count of Article Views (full-text article views including HTML views, PDF and ePub downloads, according to the available data) and Abstracts Views on Vision4Press platform.
Data correspond to usage on the plateform after 2015. The current usage metrics is available 48-96 hours after online publication and is updated daily on week days.
Initial download of the metrics may take a while.