Fig. A.2
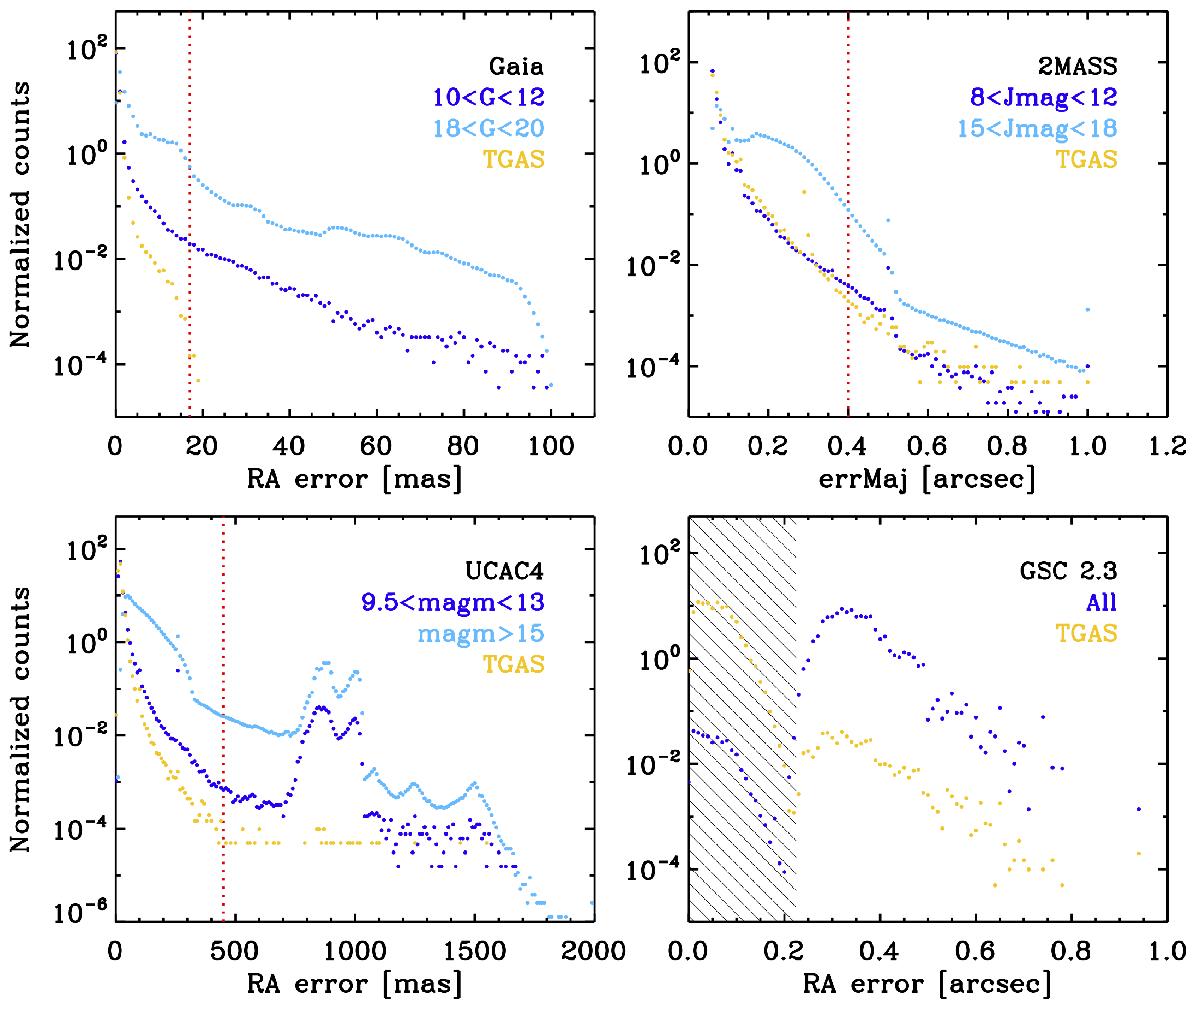
RA error distribution for Gaia, 2MASS PSC, UCAC4, and GSC 2.3. The position error distribution is shown in light blue for the bulk of the sources in each catalogue, and in blue for all the sources in each catalogue in the same magnitude range as TGAS (for Gaia) or TGAS counterparts (for the external catalogues). Each corresponding magnitude range is colour-coded and reported in the legend of each panel. In yellow is shown the distribution of the position errors for TGAS in the case of Gaia or the TGAS counterparts in the external catalogues matched using the proper motions. For GSC 2.3 the blue dots indicate the full catalogue error distribution. The distribution of Dec error shows the same behaviour.
Current usage metrics show cumulative count of Article Views (full-text article views including HTML views, PDF and ePub downloads, according to the available data) and Abstracts Views on Vision4Press platform.
Data correspond to usage on the plateform after 2015. The current usage metrics is available 48-96 hours after online publication and is updated daily on week days.
Initial download of the metrics may take a while.