Fig. 5
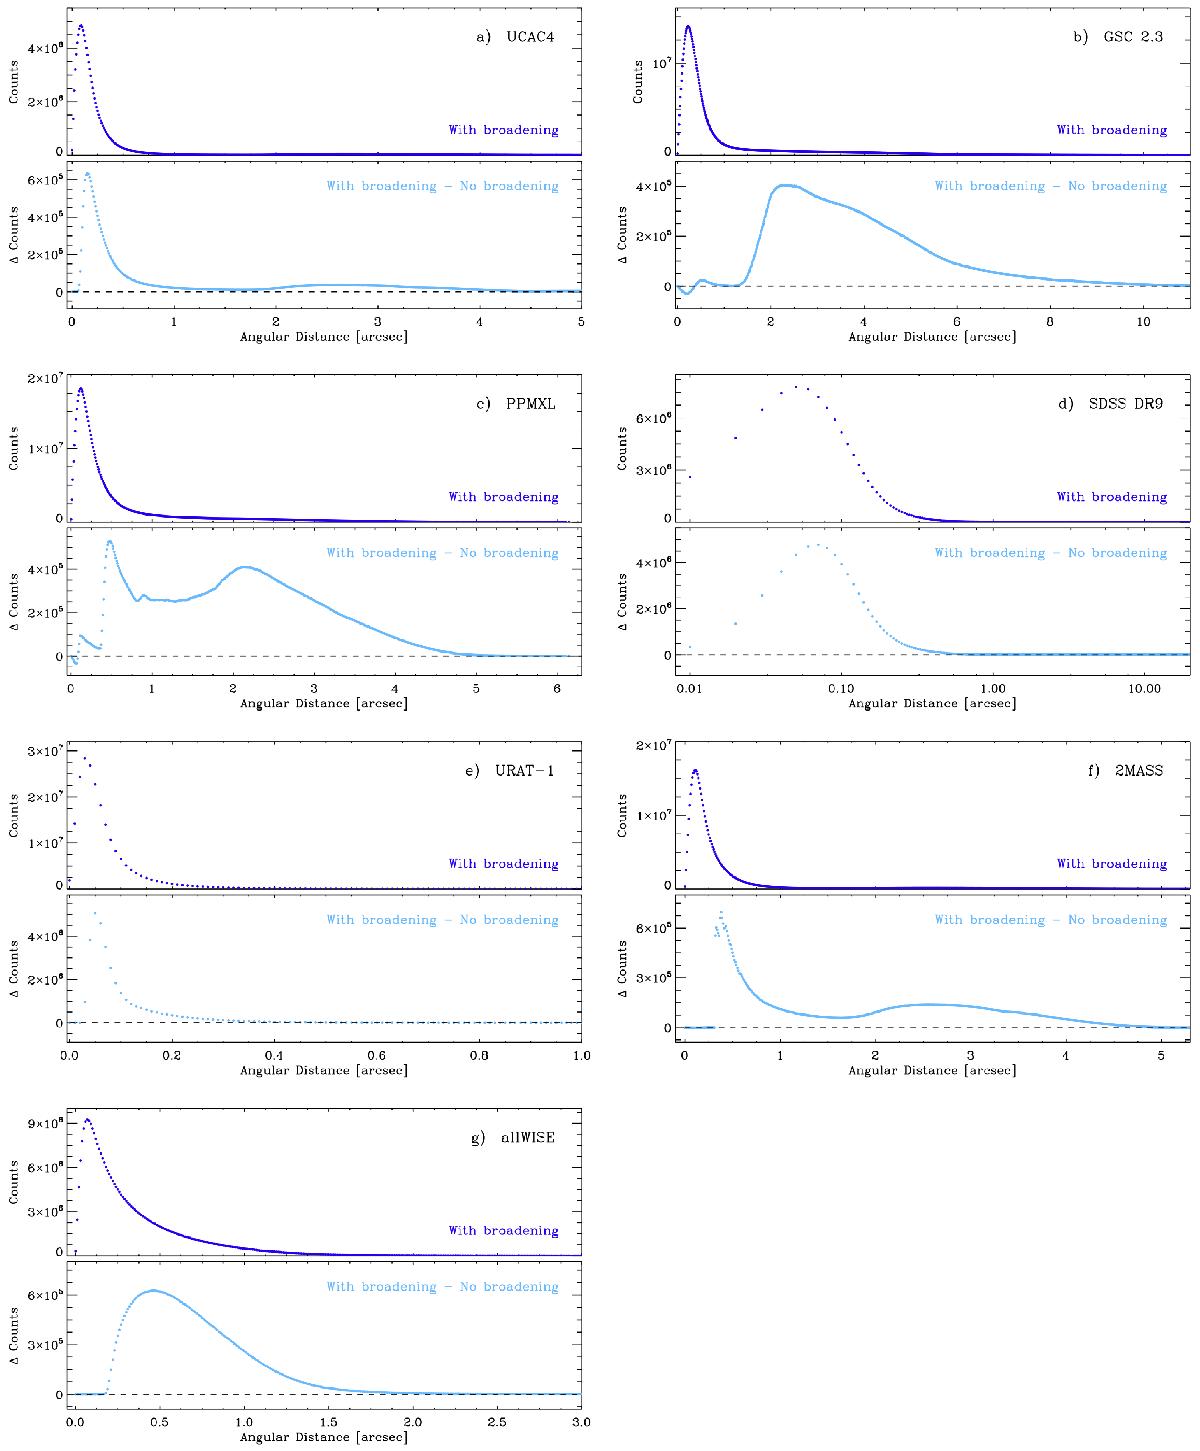
Angular distance distribution of the matched pairs in the BestNeighbour table for the different external catalogues. For each catalogue in the top plot of each panel the results are shown for the algorithm used for Gaia DR1 cross-match (blue). The bottom plots of each panel show instead the difference between the XM results calculated with and without the position error broadening (light blue).
Current usage metrics show cumulative count of Article Views (full-text article views including HTML views, PDF and ePub downloads, according to the available data) and Abstracts Views on Vision4Press platform.
Data correspond to usage on the plateform after 2015. The current usage metrics is available 48-96 hours after online publication and is updated daily on week days.
Initial download of the metrics may take a while.