Fig. A.1
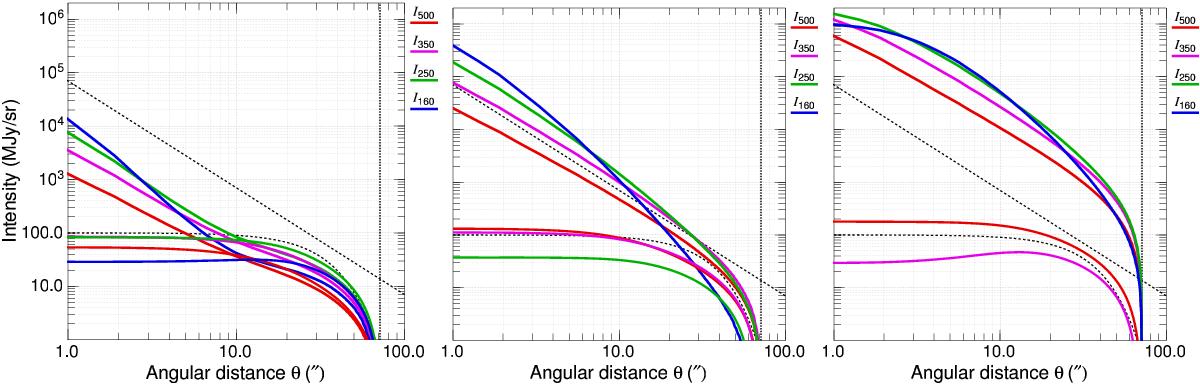
Intensity profiles of radiative transfer models. The three panels from left to right display results for masses of 0.3, 3, and 30 M⊙. In each panel, the lower and upper sets of curves show background-subtracted profiles of starless cores and protostellar envelopes, respectively, for selected Herschel wavelengths of 160, 250, 350, and 500 μm. For reference, the black dashed curves visualize a Gaussian profile and a power-law slope Iλ ∝ θ2, whereas the dotted vertical line indicates the outer radius of the models.
Current usage metrics show cumulative count of Article Views (full-text article views including HTML views, PDF and ePub downloads, according to the available data) and Abstracts Views on Vision4Press platform.
Data correspond to usage on the plateform after 2015. The current usage metrics is available 48-96 hours after online publication and is updated daily on week days.
Initial download of the metrics may take a while.