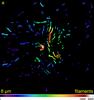
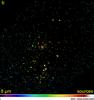
Fig. 7
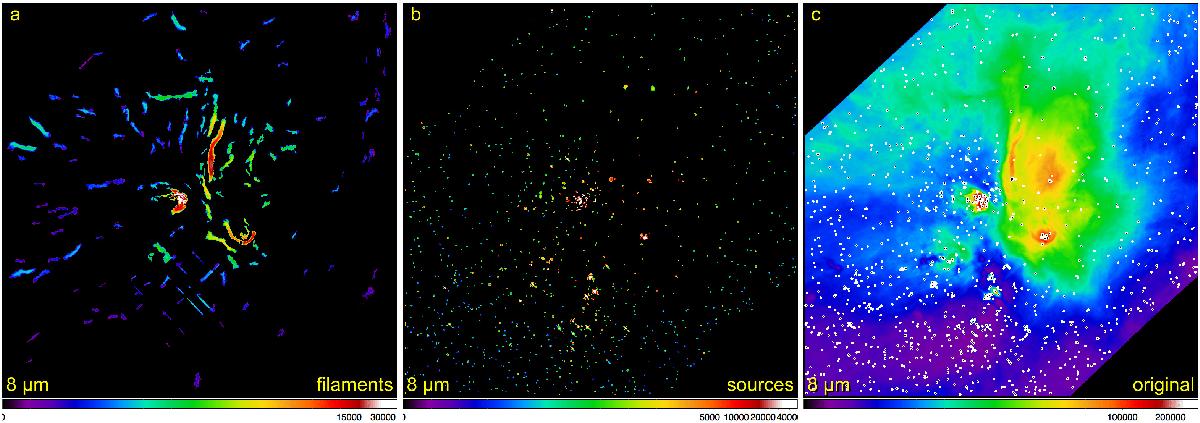
Application of getsources and getfilaments to the flattened detection images ℐλD shown in Fig. 6i. Different structural components are separated as independent images of filaments (a) and sources (b). For reference, the extraction ellipses for all detected sources (most of them may be background galaxies) are also overlaid on the original observed image ℐλ (c). Intensities (in MJy/sr) are plotted with logarithmic color scaling.
Current usage metrics show cumulative count of Article Views (full-text article views including HTML views, PDF and ePub downloads, according to the available data) and Abstracts Views on Vision4Press platform.
Data correspond to usage on the plateform after 2015. The current usage metrics is available 48-96 hours after online publication and is updated daily on week days.
Initial download of the metrics may take a while.