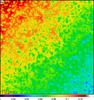
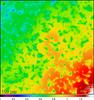
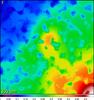
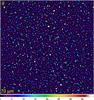
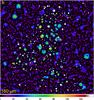
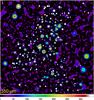
Fig. 4
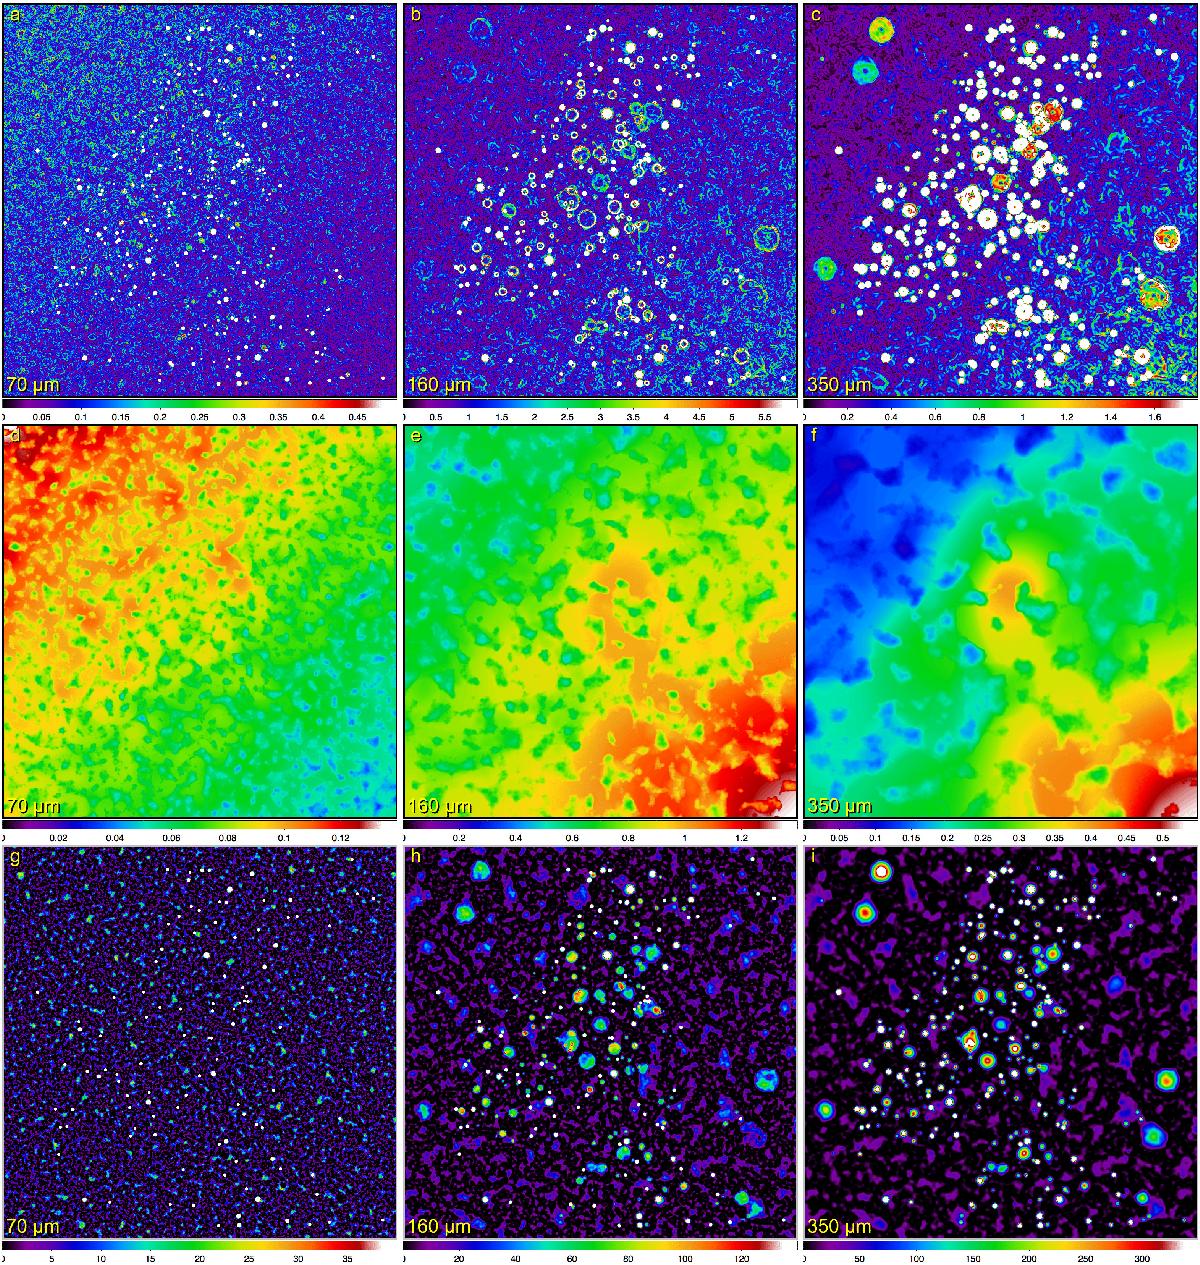
Flattening background-subtracted images (Fig. 2). Shown are the standard deviations ![]() of small-scale fluctuations in
of small-scale fluctuations in ![]() (upper row), median-filtered scaling (flattening) images
(upper row), median-filtered scaling (flattening) images ![]() (middle row), and flattened detection images
(middle row), and flattened detection images ![]() (bottom row) at selected Herschel wavelengths. In panel b, thin ring-like structures reflect the off-center temperature peaks in starless cores illuminated by the interstellar radiation field. The maximum sizes Xλ of 25, 100, and 100′′ are the same as those used for background derivation.
(bottom row) at selected Herschel wavelengths. In panel b, thin ring-like structures reflect the off-center temperature peaks in starless cores illuminated by the interstellar radiation field. The maximum sizes Xλ of 25, 100, and 100′′ are the same as those used for background derivation.
Current usage metrics show cumulative count of Article Views (full-text article views including HTML views, PDF and ePub downloads, according to the available data) and Abstracts Views on Vision4Press platform.
Data correspond to usage on the plateform after 2015. The current usage metrics is available 48-96 hours after online publication and is updated daily on week days.
Initial download of the metrics may take a while.