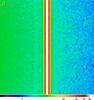
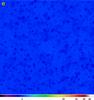
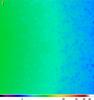
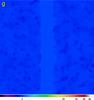
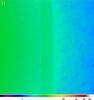
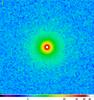
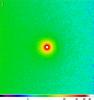
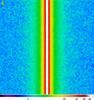
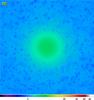
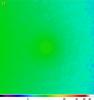
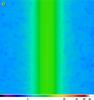
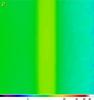
Fig. B.1
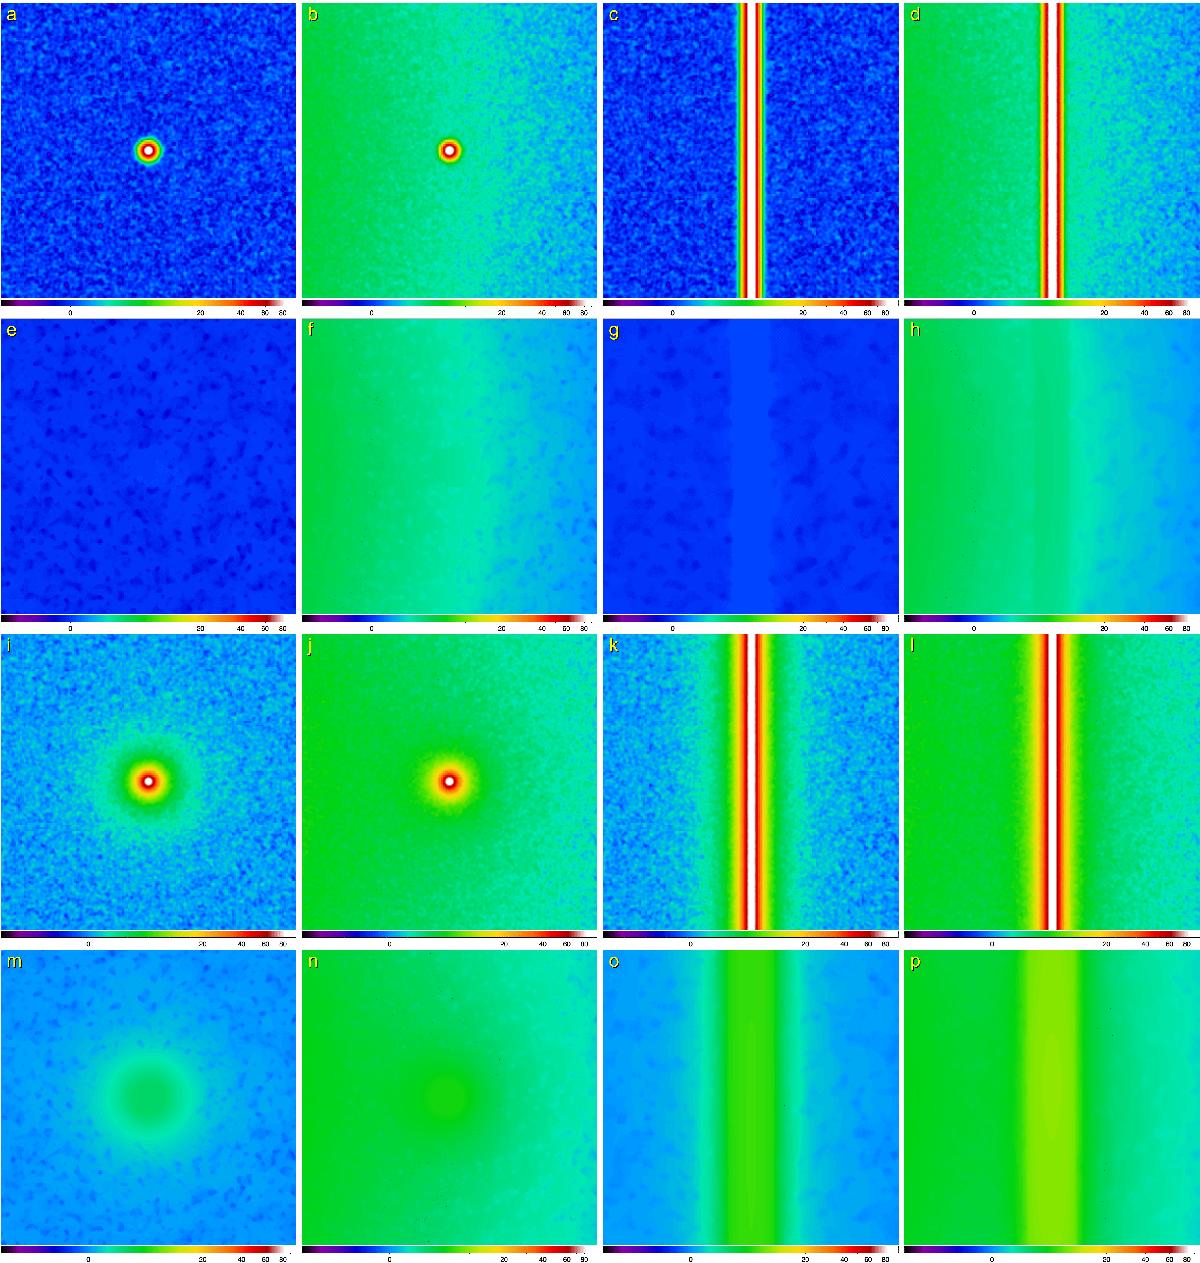
Simulated sources and filaments with H = 8′′ and their median-filtered W = 4 counterparts (cf. Sect. 2.1). The two upper rows show the simulated Gaussian structures ![]() ,
, ![]()
![]() ,
, ![]() in panels a–d and their median-filtered images in panels e–h. The two bottom rows show the simulated power-law structures
in panels a–d and their median-filtered images in panels e–h. The two bottom rows show the simulated power-law structures ![]() ,
, ![]() ,
, ![]() ,
, ![]() in panels i–l and their median-filtered images in panels m–p. The images with an intensity range of [−0.3,100 ] and sizes of 200′′ are profiled in Fig. 1. The images are displayed with logarithmic color scaling.
in panels i–l and their median-filtered images in panels m–p. The images with an intensity range of [−0.3,100 ] and sizes of 200′′ are profiled in Fig. 1. The images are displayed with logarithmic color scaling.

Current usage metrics show cumulative count of Article Views (full-text article views including HTML views, PDF and ePub downloads, according to the available data) and Abstracts Views on Vision4Press platform.
Data correspond to usage on the plateform after 2015. The current usage metrics is available 48-96 hours after online publication and is updated daily on week days.
Initial download of the metrics may take a while.