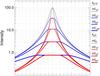
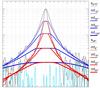
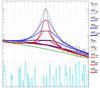
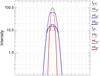
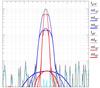
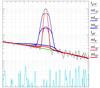
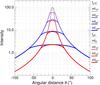
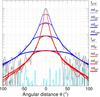
Fig. 1
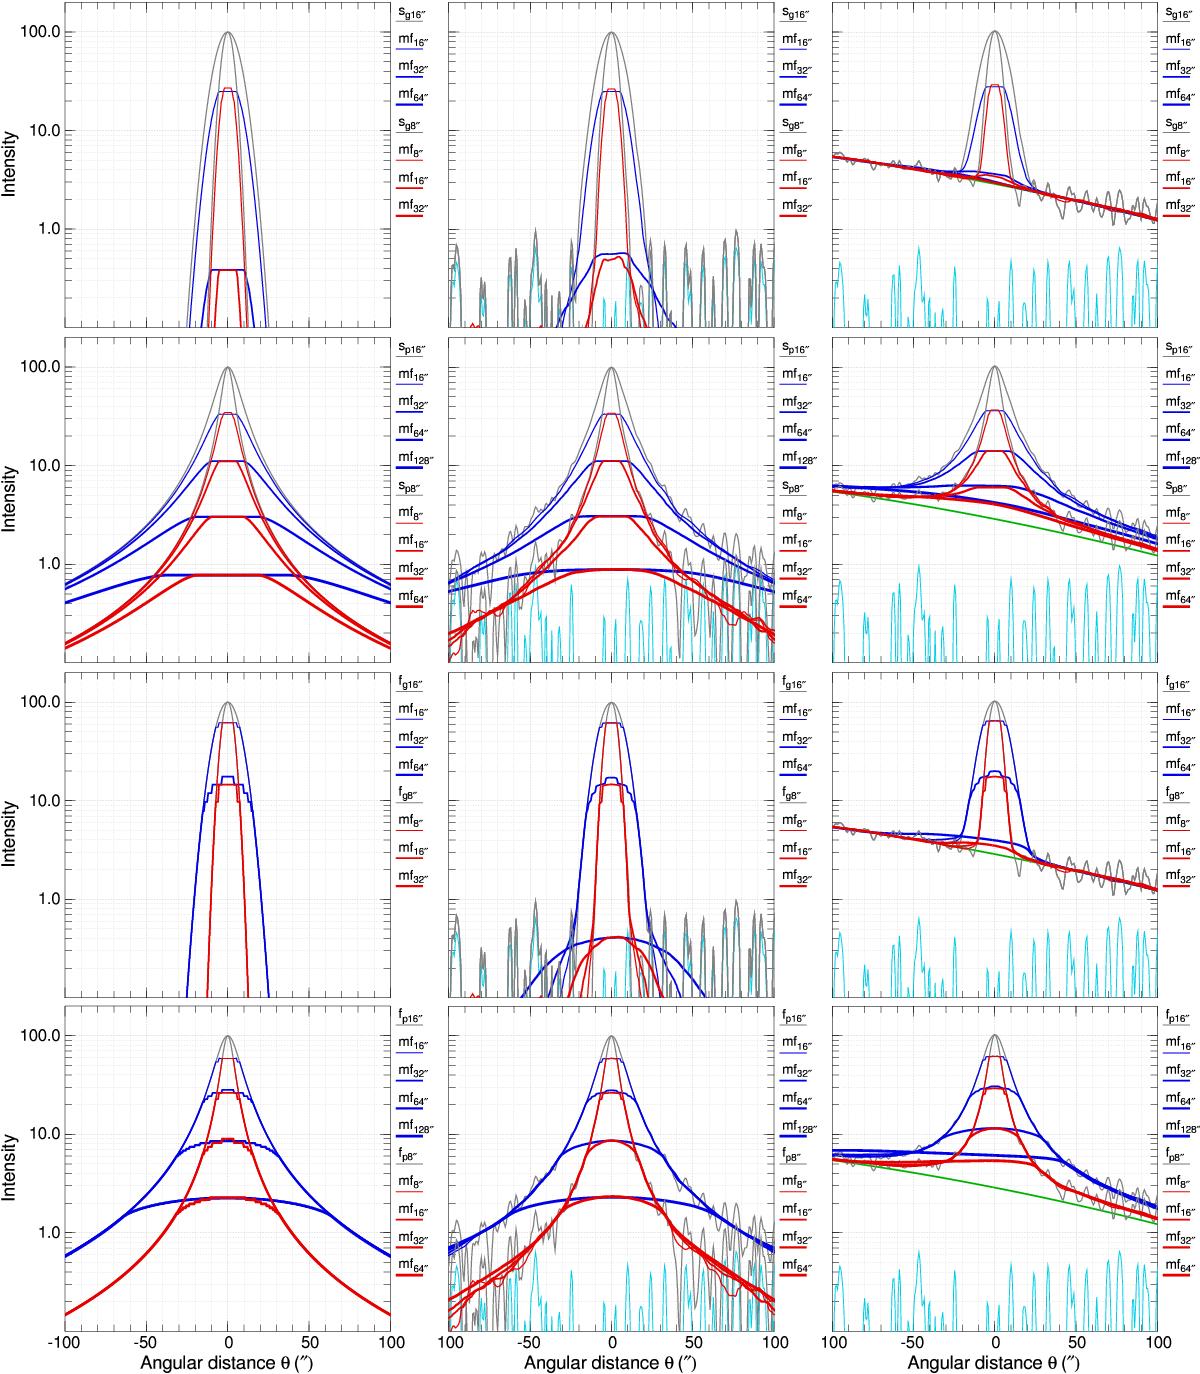
Median filtering applied to Gaussian sources ![]() (upper row), power-law sources
(upper row), power-law sources ![]() (second row), Gaussian filaments ℱG (third row), and power-law filaments ℱP (bottom row) with sizes H (FWHM) of 8′′ and 16′′ (left) and to the same images after addition of random Gaussian noise
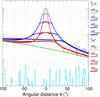
(second row), Gaussian filaments ℱG (third row), and power-law filaments ℱP (bottom row) with sizes H (FWHM) of 8′′ and 16′′ (left) and to the same images after addition of random Gaussian noise ![]() with σ = 0.33 (middle) and background ℬ modeled as a large Gaussian with FWHM of 512′′ (right). The radii R of circular sliding windows given by the indices on the curve labels correspond to the relative radii W = R/H = { 1,2,4,8 }. Original intensity profiles of
with σ = 0.33 (middle) and background ℬ modeled as a large Gaussian with FWHM of 512′′ (right). The radii R of circular sliding windows given by the indices on the curve labels correspond to the relative radii W = R/H = { 1,2,4,8 }. Original intensity profiles of ![]() ,
, ![]() , ℱG, and ℱP are shown in gray, filtered profiles of the sources and filaments with H = 8 and 16′′ are plotted in red and blue, whereas profiles of
, ℱG, and ℱP are shown in gray, filtered profiles of the sources and filaments with H = 8 and 16′′ are plotted in red and blue, whereas profiles of ![]() and ℬ are colored in cyan and green, respectively. Large sliding windows (W> 2) truncate Gaussian shapes so efficiently (cf. Table 1) that some of the annotated curves become invisible (fall entirely below the lower edge of the plots).
and ℬ are colored in cyan and green, respectively. Large sliding windows (W> 2) truncate Gaussian shapes so efficiently (cf. Table 1) that some of the annotated curves become invisible (fall entirely below the lower edge of the plots).
Current usage metrics show cumulative count of Article Views (full-text article views including HTML views, PDF and ePub downloads, according to the available data) and Abstracts Views on Vision4Press platform.
Data correspond to usage on the plateform after 2015. The current usage metrics is available 48-96 hours after online publication and is updated daily on week days.
Initial download of the metrics may take a while.