Fig. 7
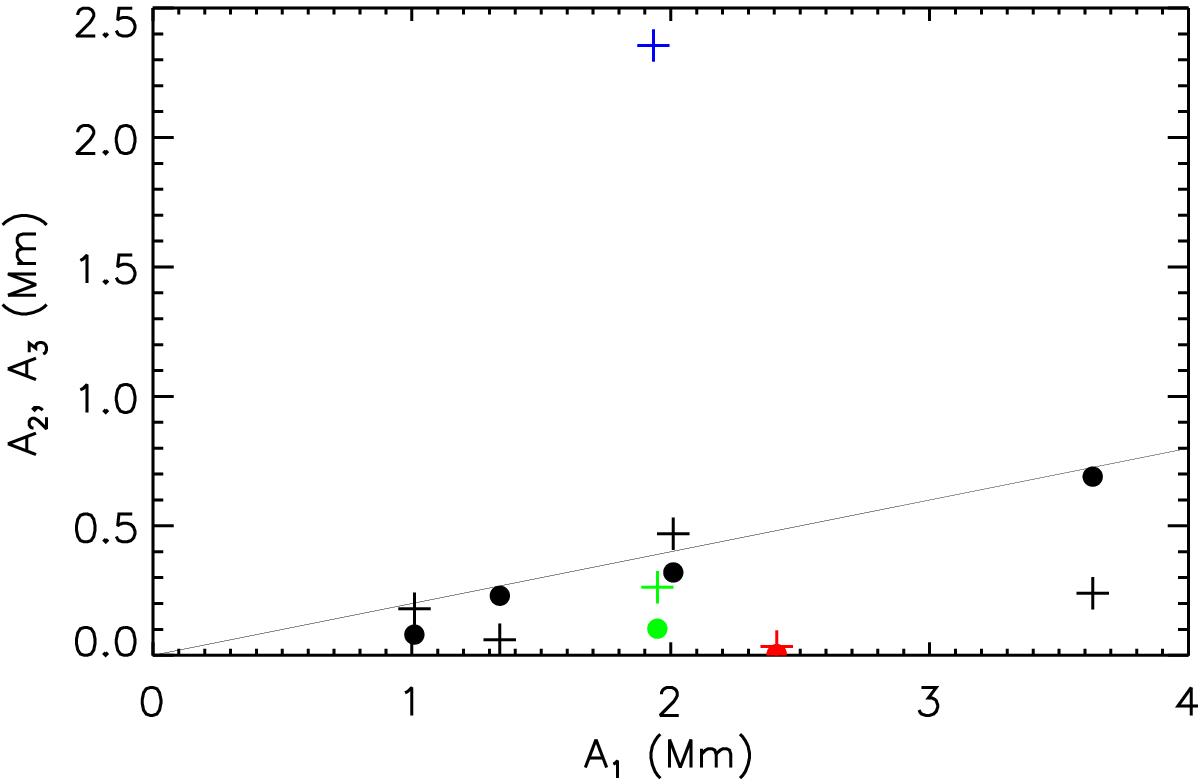
Amplitude of the second harmonic A2 (plus signs) and third harmonic A3 (circles) compared with the amplitude of the fundamental mode A1. The symbols represent the oscillations analysed by Pascoe et al. (2017a) (black), the contracting loop in this paper (red), and SOL2012-10-20 analysed in Sect. 4.2 (green). The blue datapoint is the strongly excited second harmonic reported in Pascoe et al. (2016a). The solid line denotes an amplitude of 0.2A1.
Current usage metrics show cumulative count of Article Views (full-text article views including HTML views, PDF and ePub downloads, according to the available data) and Abstracts Views on Vision4Press platform.
Data correspond to usage on the plateform after 2015. The current usage metrics is available 48-96 hours after online publication and is updated daily on week days.
Initial download of the metrics may take a while.