Fig. 3
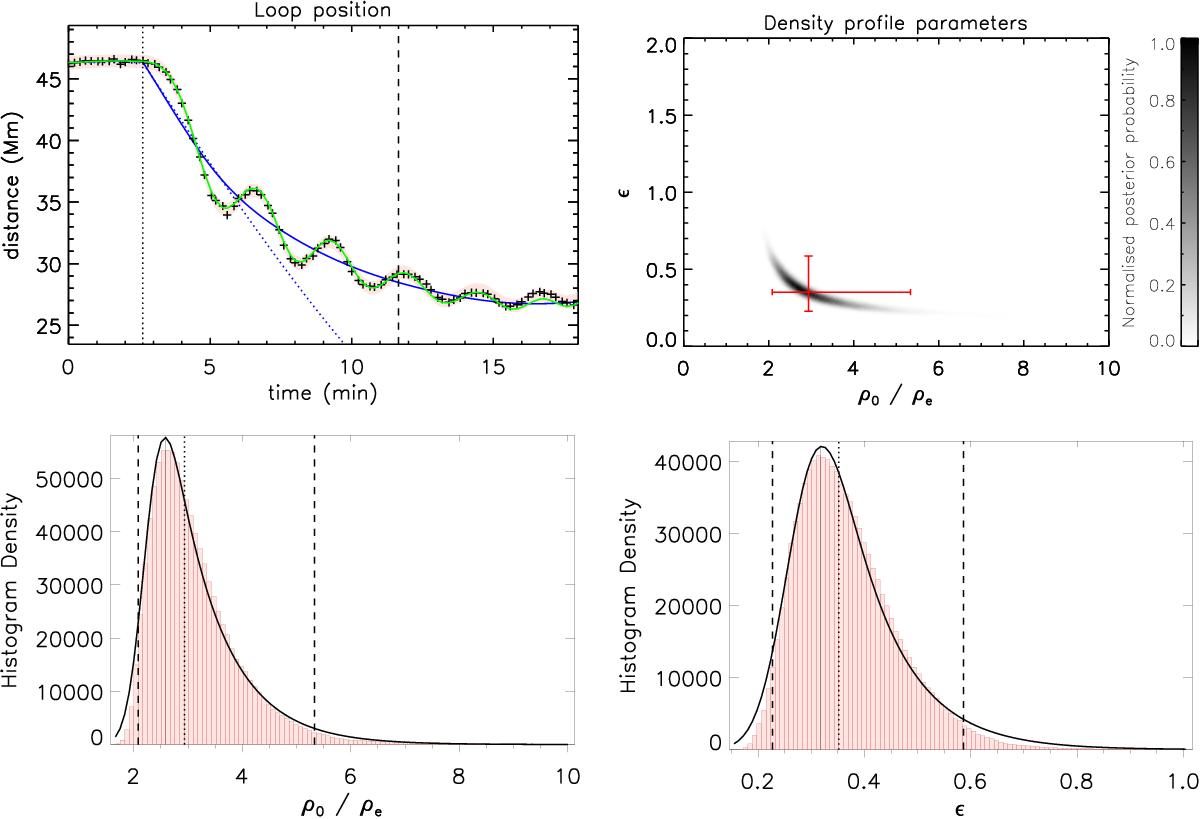
Seismological analysis of the contracting loop. The top left panel shows the position of the contracting and oscillating loop as a function of time. The green and blue lines represent our model for the position and background trend alone, respectively, based on the median value of each model parameter. The dotted blue line represents the component of the background trend corresponding to the equilibrium shift given by Eq. (4). The rose shaded region represents the 99% credible intervals for the loop position predicted by the model, which includes an estimated noise σy. The dotted and dashed lines denote the median values of t0 and ts1, respectively. The top right panel shows a normalised 2D histogram approximating the marginalised posterior probability density function for the loop transverse density profile parameters, estimated using the oscillation damping envelope. The red bars indicate the median values and the 95% credible intervals, which are also shown by the dotted and dashed lines, respectively, in the 1D histograms (bottom panels).
Current usage metrics show cumulative count of Article Views (full-text article views including HTML views, PDF and ePub downloads, according to the available data) and Abstracts Views on Vision4Press platform.
Data correspond to usage on the plateform after 2015. The current usage metrics is available 48-96 hours after online publication and is updated daily on week days.
Initial download of the metrics may take a while.