Fig. 3
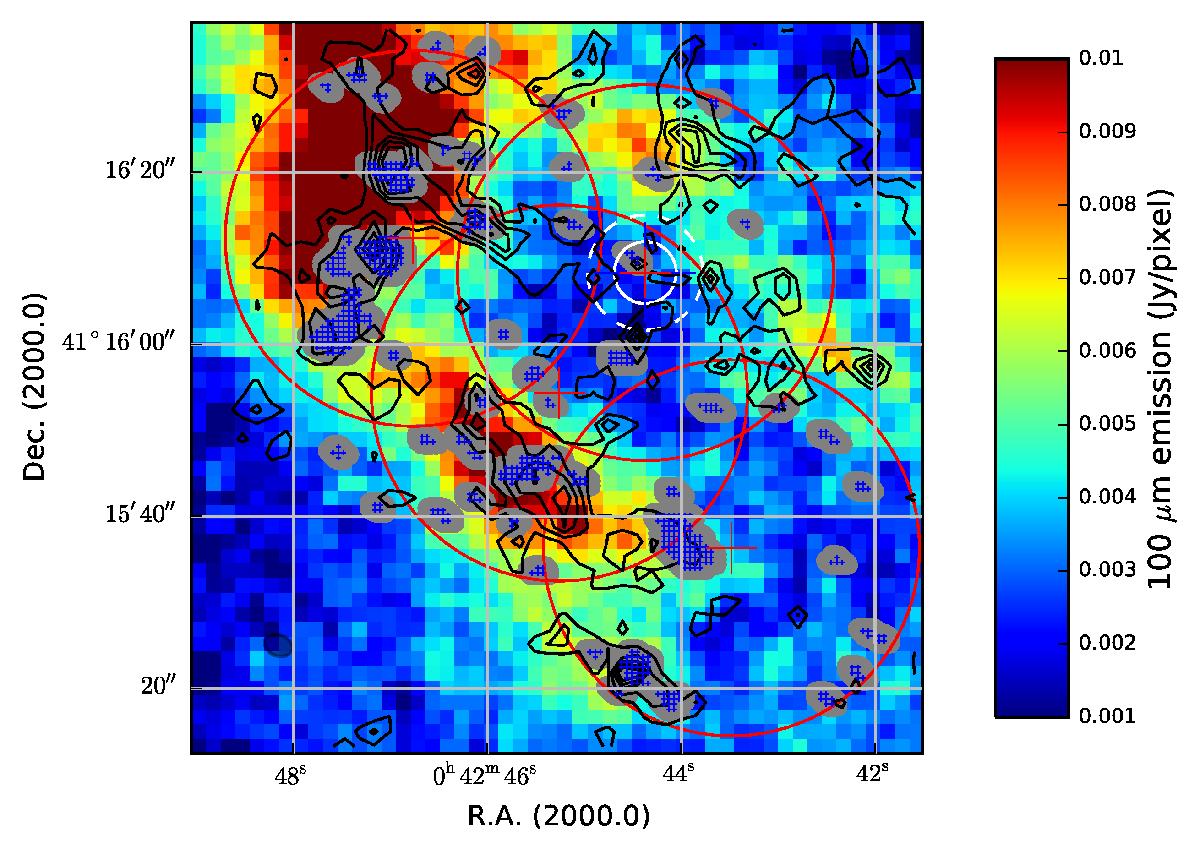
Position of CO excess superimposed on 100 μm Herschel/PACS map. The contours (1.5, 2.6, 3.7, 4.9, and 6 MJy/sr) correspond to the Spitzer 8 μm map where the stellar continuum has been substracted by the adjustment of elliptical annuli using the standard surface photometry algorithm developed for IRAF (Jedrzejewski 1987). The projected field of view is 230 pc ×230 pc. Following Rimoldi et al. (2016), the white circle plotted with the dashed line corresponds to the expected extent of a molecular torus (RMT = 25 pc ~ 6.7″), while the white circle plotted with the full line corresponds to the radius of the sphere of influence of the black hole (RSOI = 14 pc ~ 3.7″), as displayed in Fig. 1.
Current usage metrics show cumulative count of Article Views (full-text article views including HTML views, PDF and ePub downloads, according to the available data) and Abstracts Views on Vision4Press platform.
Data correspond to usage on the plateform after 2015. The current usage metrics is available 48-96 hours after online publication and is updated daily on week days.
Initial download of the metrics may take a while.