Fig. 1
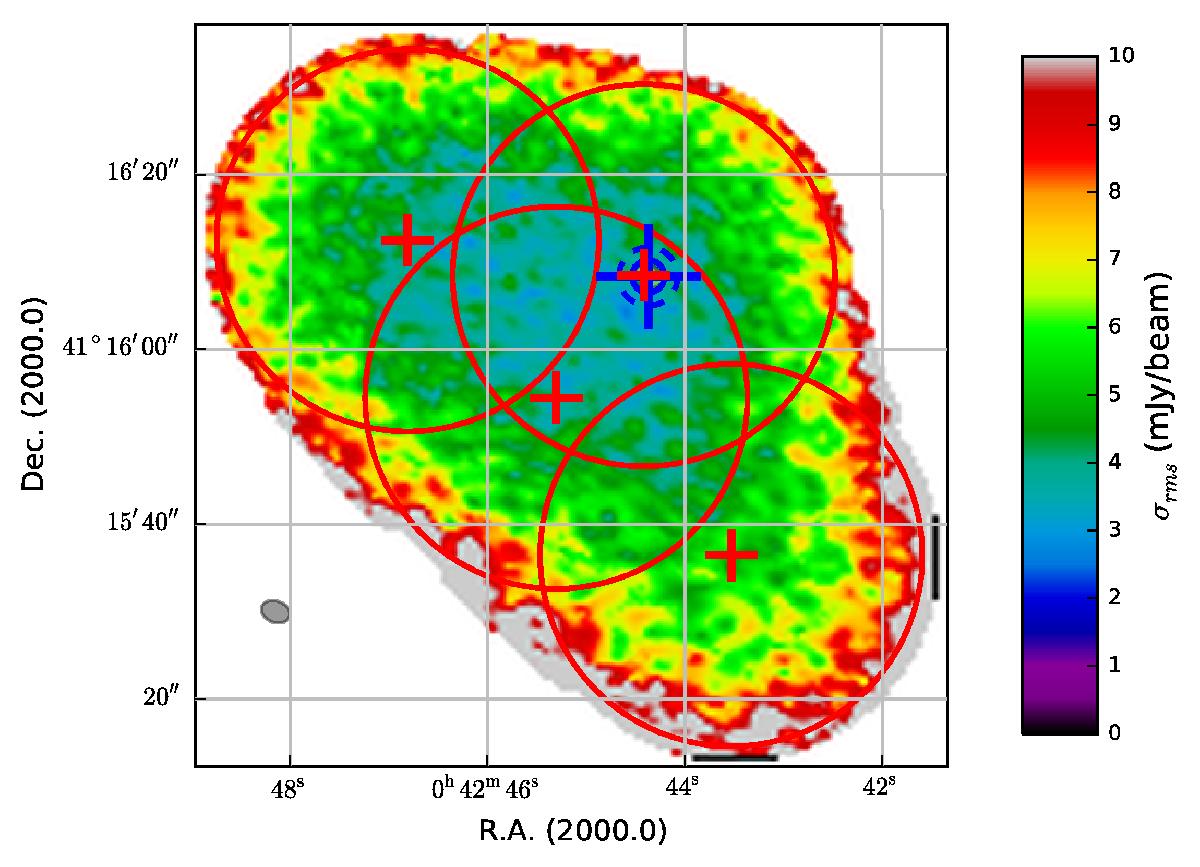
IRAM-PdB CO(1−0) rms map. The colour-coding corresponds to the noise level (σrms), corrected for the primary beam, of the map obtained at the IRAM-PdB. The blue cross indicates the (optical) centre of Andromeda (Crane et al. 1992). The red crosses correspond to the centre of the four fields observed at PdB with a half-power primary beam of 43.7′′ represented by red circles. The half-power beam is presented in the bottom left corner of the CO(1−0) observations.
Current usage metrics show cumulative count of Article Views (full-text article views including HTML views, PDF and ePub downloads, according to the available data) and Abstracts Views on Vision4Press platform.
Data correspond to usage on the plateform after 2015. The current usage metrics is available 48-96 hours after online publication and is updated daily on week days.
Initial download of the metrics may take a while.