Fig. 9
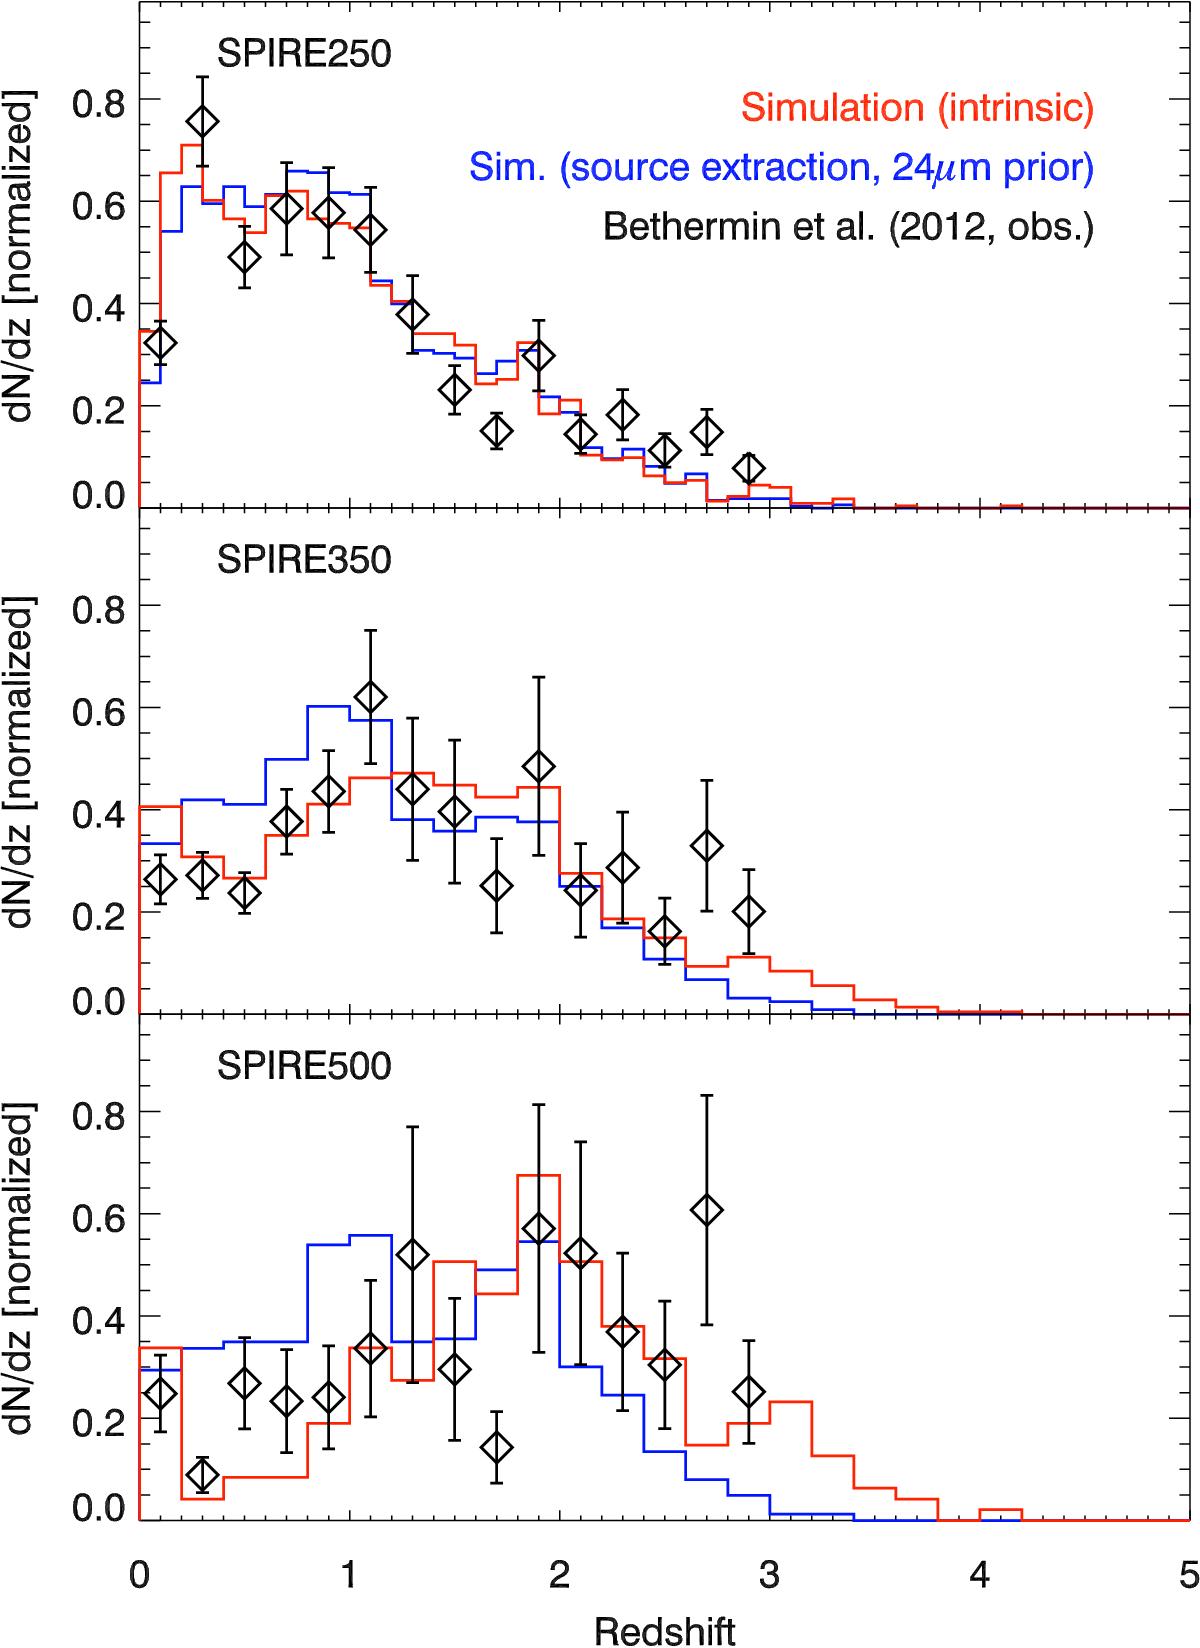
Illustration of the impact of the 24 μm-prior extraction on the redshift distribution at 250, 350, and 500 μm. A flux density cut of 20 mJy was used to select the SPIRE sources. The red line is the intrinsic redshift distribution, while the blue line is obtained after extracting the sources in our simulated Herschel/SPIRE maps using 24 μm positions as a prior. The histograms are normalized in order to have ∫dN/ dz dz = 1. We compare these model predictions with the observational redshift distribution of Béthermin et al. (2012c, black diamonds). The data points were extracted in real Herschel data using position, 24-μm flux density, and redshift as a prior. This more complex method was chosen to avoid the potential biases associated with a source extraction using only 24-μm positions as a prior (see discussion in Sect. 4.1).
Current usage metrics show cumulative count of Article Views (full-text article views including HTML views, PDF and ePub downloads, according to the available data) and Abstracts Views on Vision4Press platform.
Data correspond to usage on the plateform after 2015. The current usage metrics is available 48-96 hours after online publication and is updated daily on week days.
Initial download of the metrics may take a while.