Fig. 6
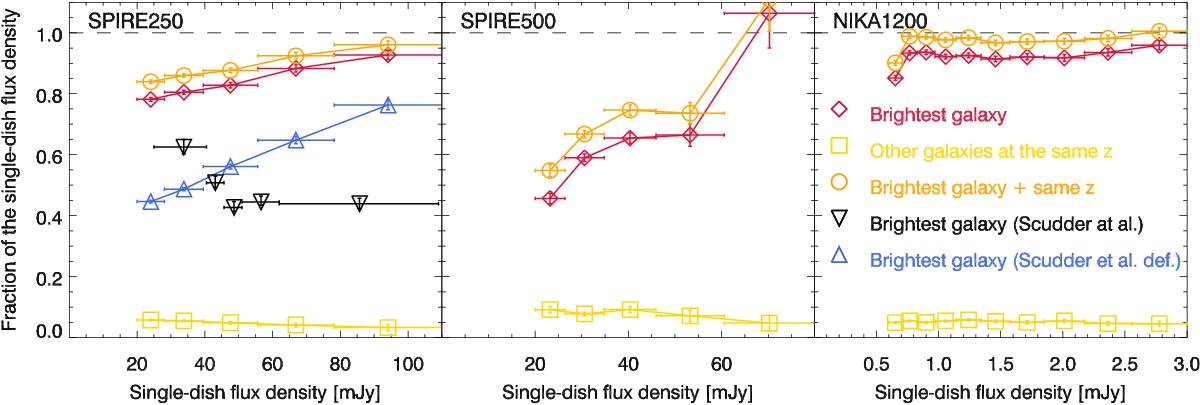
Average fraction of the flux density emitted by the brightest galaxy in the beam as function of the flux density measured in our simulated map with a limited angular resolution (red diamonds). We present our results for Herschel/SPIRE at 250 μm (left) and 500 μm (middle), and for NIKA2 at 1.2 mm (right). The gold squares show the average contribution of the galaxies physically related (| Δz | < 0.01) to the brightest galaxy in the beam. The orange open circles are the sum of the flux density fraction from the brightest galaxy and the other galaxies at the same redshift. The black downward-facing triangles is the flux density fraction from the brightest galaxy measured by Scudder et al. (2016). They used a different definition from ours and divided the flux density of the brightest galaxy by the total of the flux density of all the galaxies in a 1 FWHM radius. The blue upward-facing triangles are the results from our simulation assuming their definition (see Sect. 3.4).
Current usage metrics show cumulative count of Article Views (full-text article views including HTML views, PDF and ePub downloads, according to the available data) and Abstracts Views on Vision4Press platform.
Data correspond to usage on the plateform after 2015. The current usage metrics is available 48-96 hours after online publication and is updated daily on week days.
Initial download of the metrics may take a while.