Fig. 4
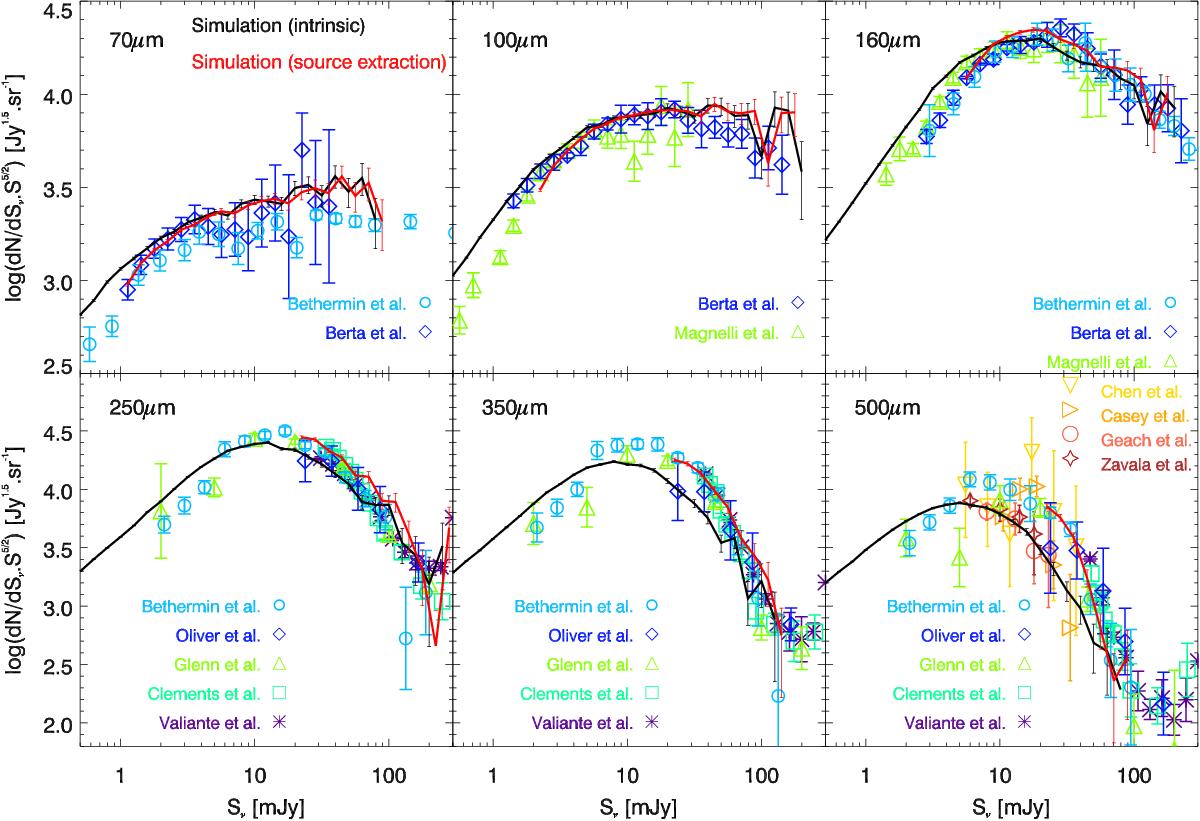
Differential number counts from 70 μm to 500 μm. The counts are multiplied by ![]() to reduce the dynamic range of the plot and to highlight the plateau at high flux densities where the Euclidian approximation is valid (e.g., Planck Collaboration Int. VII 2013). The solid black line is the prediction from our simulated catalog. The red line is derived from the extraction of sources in simulated Herschel maps using a method similar to that used by Béthermin et al. (2012a). The error bars on the prediction of the simulation are derived assuming Poisson statistics. The source extraction procedure is limited by confusion and only bright sources can be extracted reliably. From 70 μm to 160 μm, the light blue circles, the dark blue diamonds, and the green triangles are the Spizter counts of Béthermin et al. (2010a), Herschel/PEP counts of Berta et al. (2011), and Herschel/GOODS counts of Magnelli et al. (2013), respectively. From 250 μm to 500 μm, the light blue circles, the dark blue diamonds, the green triangles, turquoise squares, and purple asterisks are the Herschel/SPIRE measurements of Béthermin et al. (2012c), Oliver et al. (2010), Glenn et al. (2010), Clements et al. (2010), and Valiante et al. (2016), respectively. The SCUBA2 measurements at 450 μm of Chen et al. (2013), Casey et al. (2013), Geach et al. (2013), and Zavala et al. (2017) are shown using gold down-facing triangles, orange right-facing triangles, red open circles, and brown stars, respectively.
to reduce the dynamic range of the plot and to highlight the plateau at high flux densities where the Euclidian approximation is valid (e.g., Planck Collaboration Int. VII 2013). The solid black line is the prediction from our simulated catalog. The red line is derived from the extraction of sources in simulated Herschel maps using a method similar to that used by Béthermin et al. (2012a). The error bars on the prediction of the simulation are derived assuming Poisson statistics. The source extraction procedure is limited by confusion and only bright sources can be extracted reliably. From 70 μm to 160 μm, the light blue circles, the dark blue diamonds, and the green triangles are the Spizter counts of Béthermin et al. (2010a), Herschel/PEP counts of Berta et al. (2011), and Herschel/GOODS counts of Magnelli et al. (2013), respectively. From 250 μm to 500 μm, the light blue circles, the dark blue diamonds, the green triangles, turquoise squares, and purple asterisks are the Herschel/SPIRE measurements of Béthermin et al. (2012c), Oliver et al. (2010), Glenn et al. (2010), Clements et al. (2010), and Valiante et al. (2016), respectively. The SCUBA2 measurements at 450 μm of Chen et al. (2013), Casey et al. (2013), Geach et al. (2013), and Zavala et al. (2017) are shown using gold down-facing triangles, orange right-facing triangles, red open circles, and brown stars, respectively.
Current usage metrics show cumulative count of Article Views (full-text article views including HTML views, PDF and ePub downloads, according to the available data) and Abstracts Views on Vision4Press platform.
Data correspond to usage on the plateform after 2015. The current usage metrics is available 48-96 hours after online publication and is updated daily on week days.
Initial download of the metrics may take a while.