Fig. 3
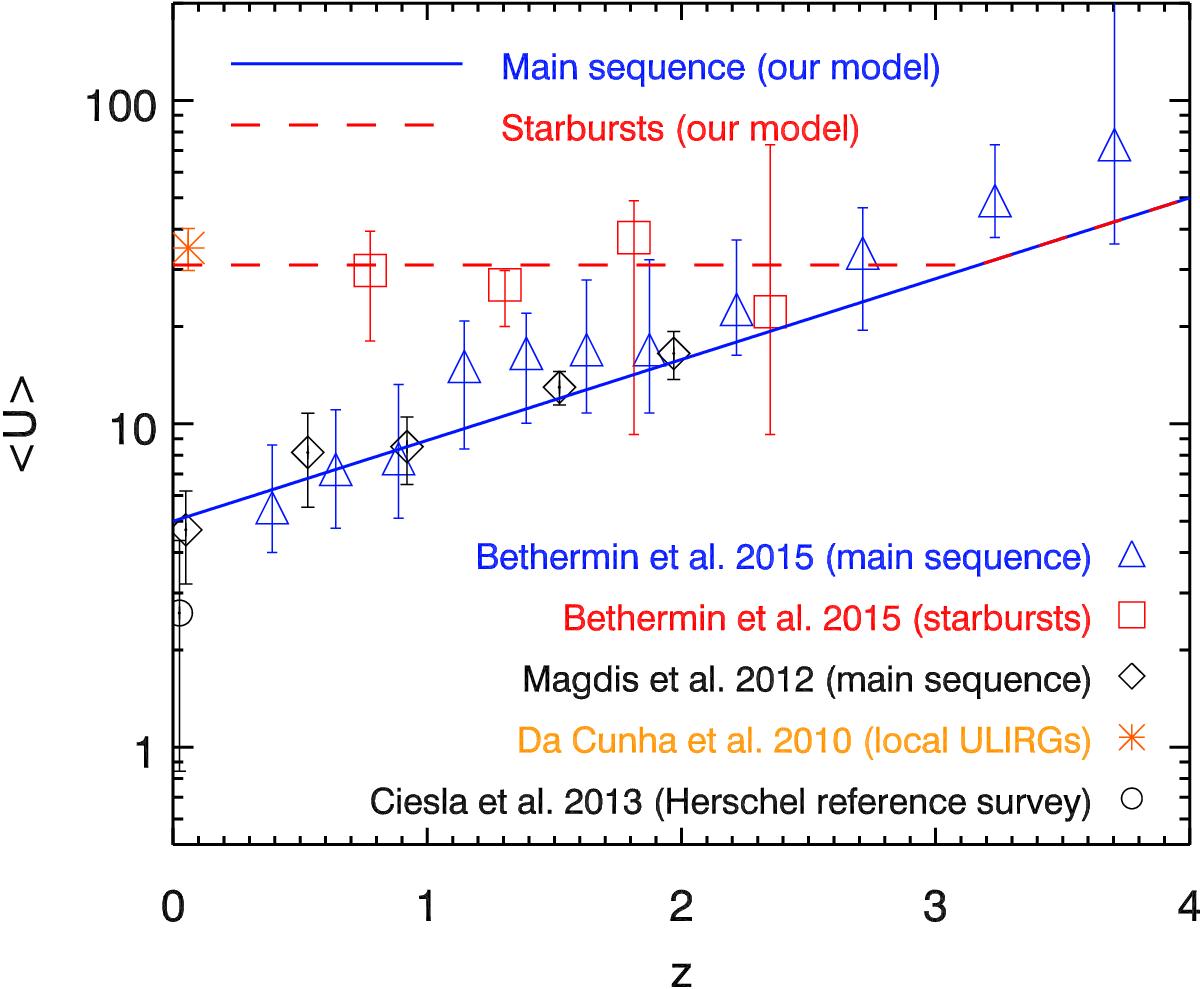
Evolution of the mean intensity of the radiation field ⟨ U ⟩ (see Magdis et al. 2012) that is used in the current updated model. The evolution of main sequence galaxies and starbursts are plotted in blue (solid line) and red (dashed line), respectively. Also shown are the measurement of Béthermin et al. (2015a, triangles for main sequence galaxies and squares for starbursts), Magdis et al. (2012, diamonds), da Cunha et al. (2010, asterisk), and Ciesla et al. (2014, circle). This figure is adapted from Béthermin et al. (2015b).
Current usage metrics show cumulative count of Article Views (full-text article views including HTML views, PDF and ePub downloads, according to the available data) and Abstracts Views on Vision4Press platform.
Data correspond to usage on the plateform after 2015. The current usage metrics is available 48-96 hours after online publication and is updated daily on week days.
Initial download of the metrics may take a while.