Fig. C.1
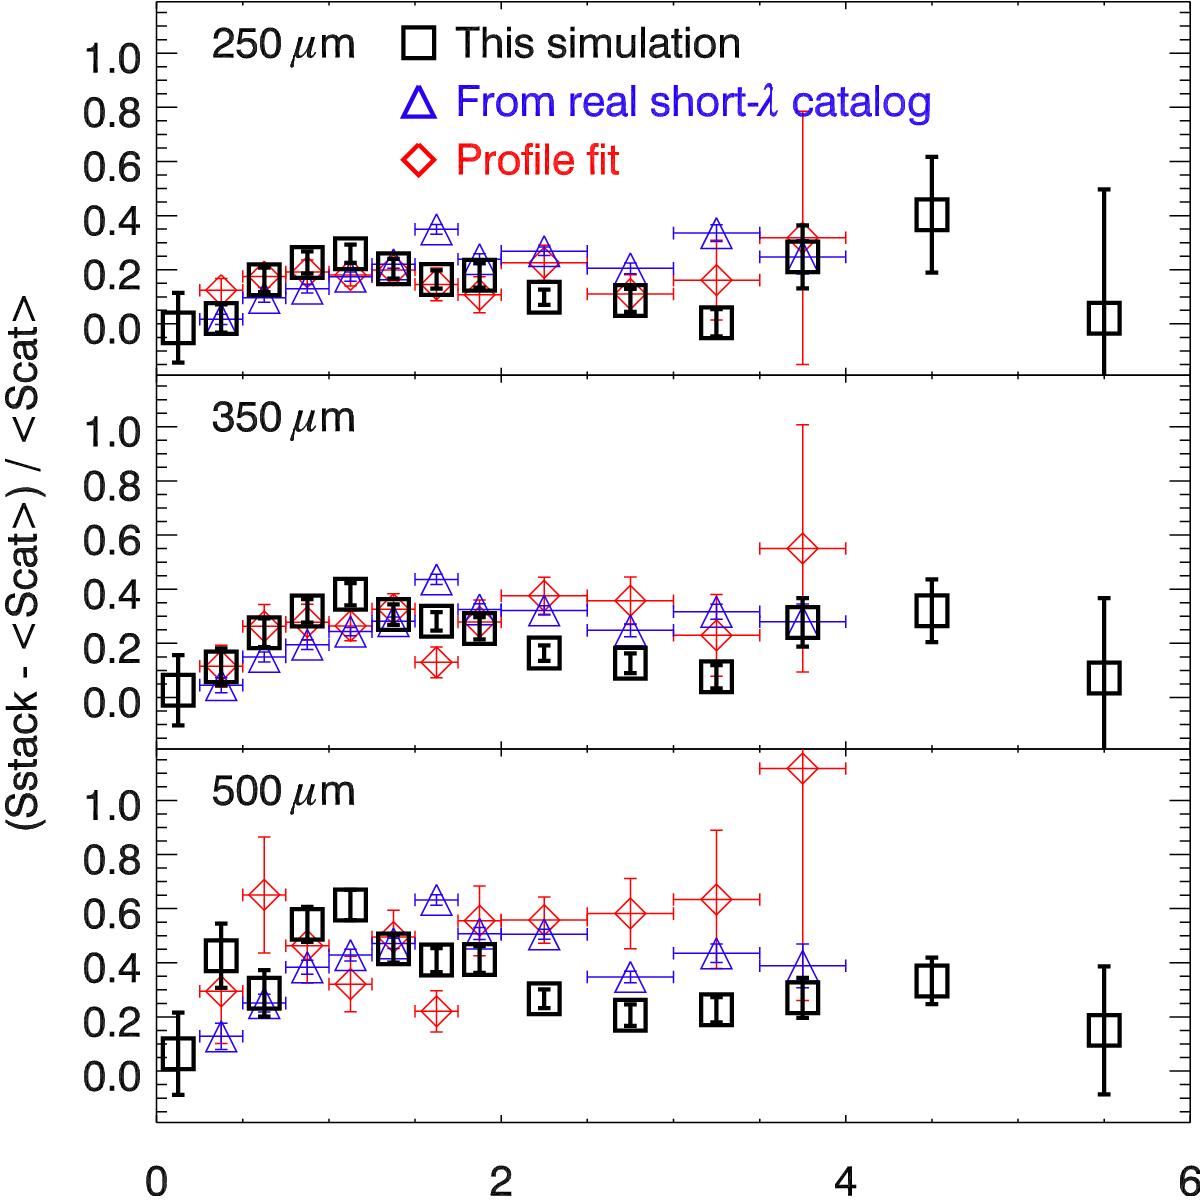
Relative excess of flux density in stacking measurements caused by clustered neighbors as a function of redshift. These values were derived for a stellar mass selection (3 × 10¹⁰ M⊙). The black squares are the results from our simulation. The blue triangles were derived using a simulated map built from the real positions and the stellar masses of the galaxies in the COSMOS field (Béthermin et al. 2015a). The red diamonds were derived using a decomposition of the real stacked images into a point-like and an extended clustered component (Béthermin et al. 2015a).
Current usage metrics show cumulative count of Article Views (full-text article views including HTML views, PDF and ePub downloads, according to the available data) and Abstracts Views on Vision4Press platform.
Data correspond to usage on the plateform after 2015. The current usage metrics is available 48-96 hours after online publication and is updated daily on week days.
Initial download of the metrics may take a while.