Fig. A.1
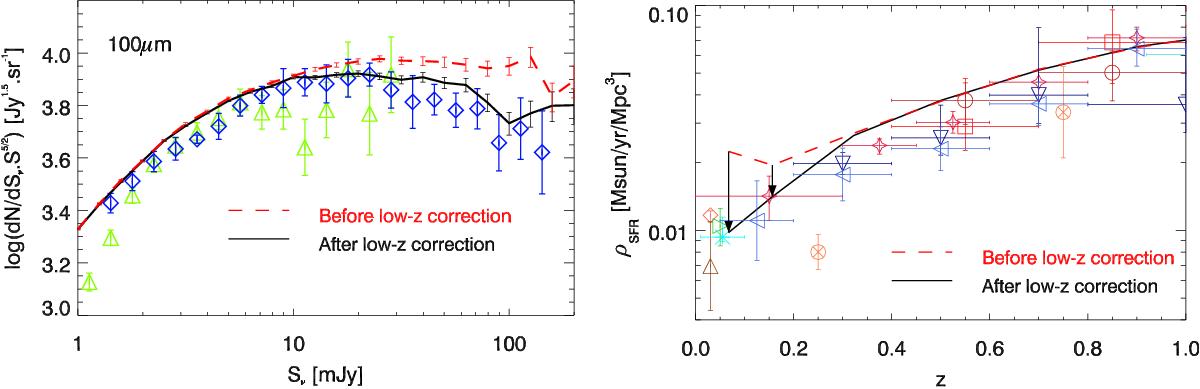
Left: differential number counts at 100 μm. We used the same data points as in Fig. 4. The red dashed line is before the correction at low redshift of the position of the main sequence (see Appendix B) and the black solid line is the final version of our model. Since this effect is only significant at bright flux density, where the number of sources is small, we used an unclustered 10 deg2 to reduce the statistical uncertainties in our model predictions. Right: star formation density as a function of redshift. The data are similar to Fig. 11, but we added the prediction of our model before the low-redshift correction of the main sequence (red dashed line).
Current usage metrics show cumulative count of Article Views (full-text article views including HTML views, PDF and ePub downloads, according to the available data) and Abstracts Views on Vision4Press platform.
Data correspond to usage on the plateform after 2015. The current usage metrics is available 48-96 hours after online publication and is updated daily on week days.
Initial download of the metrics may take a while.