Fig. 15
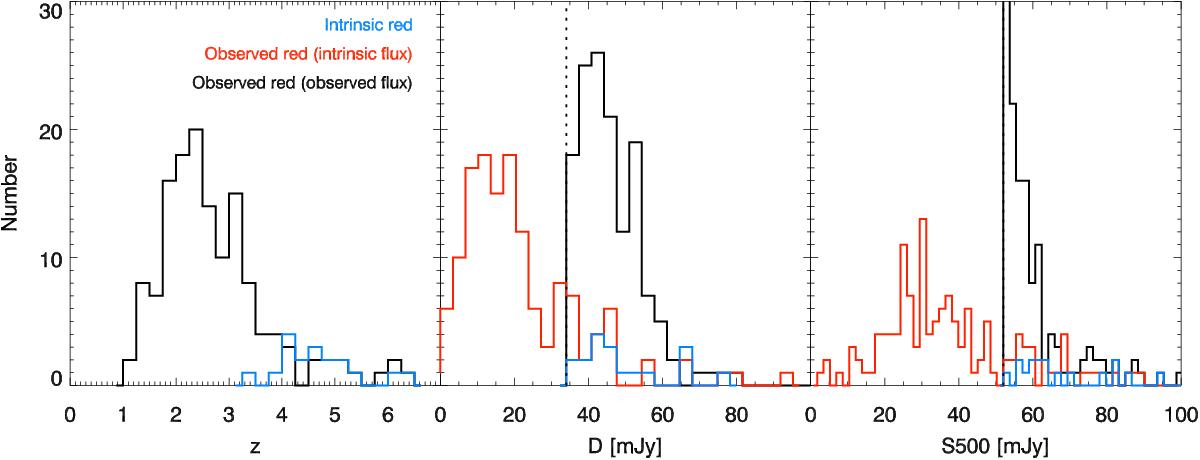
Left panel: redshift distribution of the red sources. The blue and black histograms are the distributions of the sources matching the red criteria before and after including noise (both instrument and confusion noises), respectively. Middle panel: distribution of the red excess (D = 0.92 M500−0.392 M250). Right panel: distribution of the 500 μm flux density. The blue and black histograms show the intrinsic (without including noise) 500 μm flux densities (middle panel) and D values (right panel) of the intrinsically red (red criteria applied before adding noise) and observed red (red criteria applied after adding noise) sources, respectively. The red histogram shows the distributions of the observed, that is, after including noise, 500 μm flux densities and D values of observed red sources. The difference between the black and red histogram illustrates that sources observed above the S500 and D thresholds of Asboth et al. (2016, vertical black dotted line) usually have lower intrinsic values.
Current usage metrics show cumulative count of Article Views (full-text article views including HTML views, PDF and ePub downloads, according to the available data) and Abstracts Views on Vision4Press platform.
Data correspond to usage on the plateform after 2015. The current usage metrics is available 48-96 hours after online publication and is updated daily on week days.
Initial download of the metrics may take a while.