Fig. 14
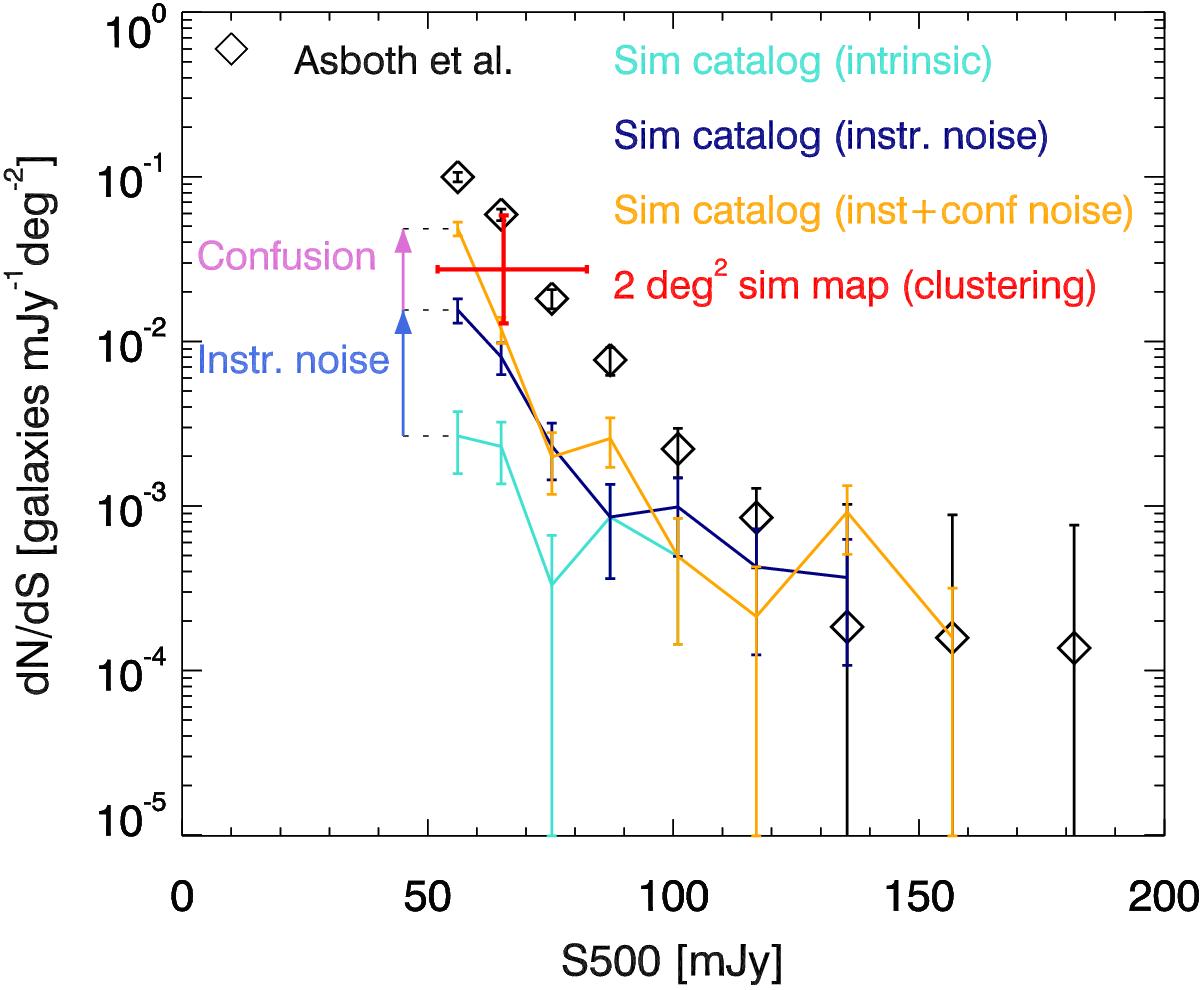
Differential number counts of red Herschel sources. The black diamonds are the measurements from Asboth et al. (2016). The red point is the result of an end-to-end analysis of our 2 deg2 simulated maps including clustering and instrumental noise. The turquoise, dark blue, and gold lines are the number counts in a simulated catalog of 274 deg2 without noise, with instrumental noise only, and with both instrumental and unclustered confusion noise, respectively. Blue and purple arrows illustrate the impact of instrumental and confusion noise, respectively.
Current usage metrics show cumulative count of Article Views (full-text article views including HTML views, PDF and ePub downloads, according to the available data) and Abstracts Views on Vision4Press platform.
Data correspond to usage on the plateform after 2015. The current usage metrics is available 48-96 hours after online publication and is updated daily on week days.
Initial download of the metrics may take a while.