Fig. 13
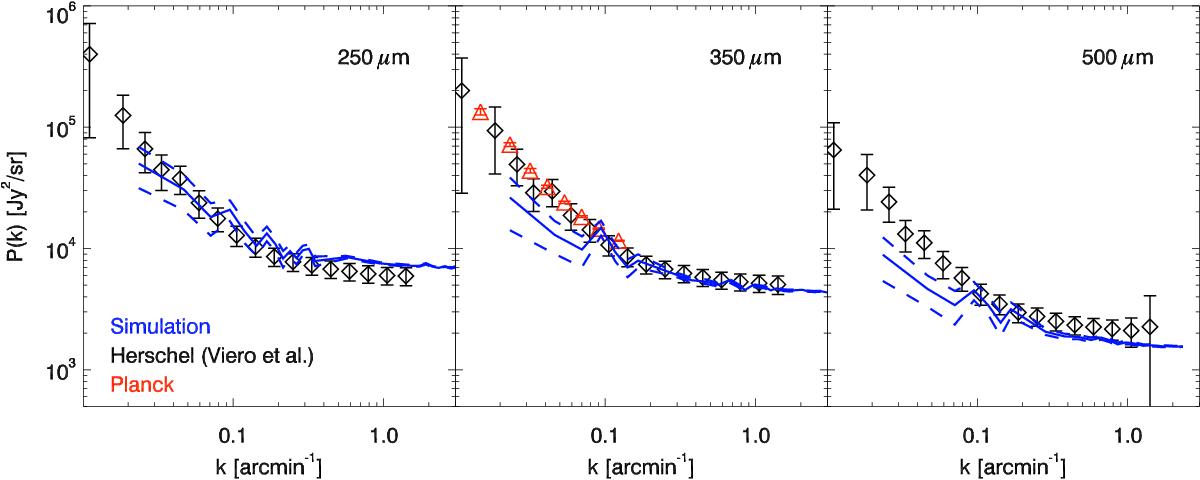
Power spectrum of cosmic infrared background anisotropies at 250, 350, and 500 μm. The blue solid lines are CIB anisotropies measured in our simulation and 1σ confidence regions are represented by the dashed lines. The black diamonds and the red triangles are the measurements of Viero et al. (2013b) and Planck Collaboration XXX (2014), respectively.
Current usage metrics show cumulative count of Article Views (full-text article views including HTML views, PDF and ePub downloads, according to the available data) and Abstracts Views on Vision4Press platform.
Data correspond to usage on the plateform after 2015. The current usage metrics is available 48-96 hours after online publication and is updated daily on week days.
Initial download of the metrics may take a while.