Free Access
Fig. 12
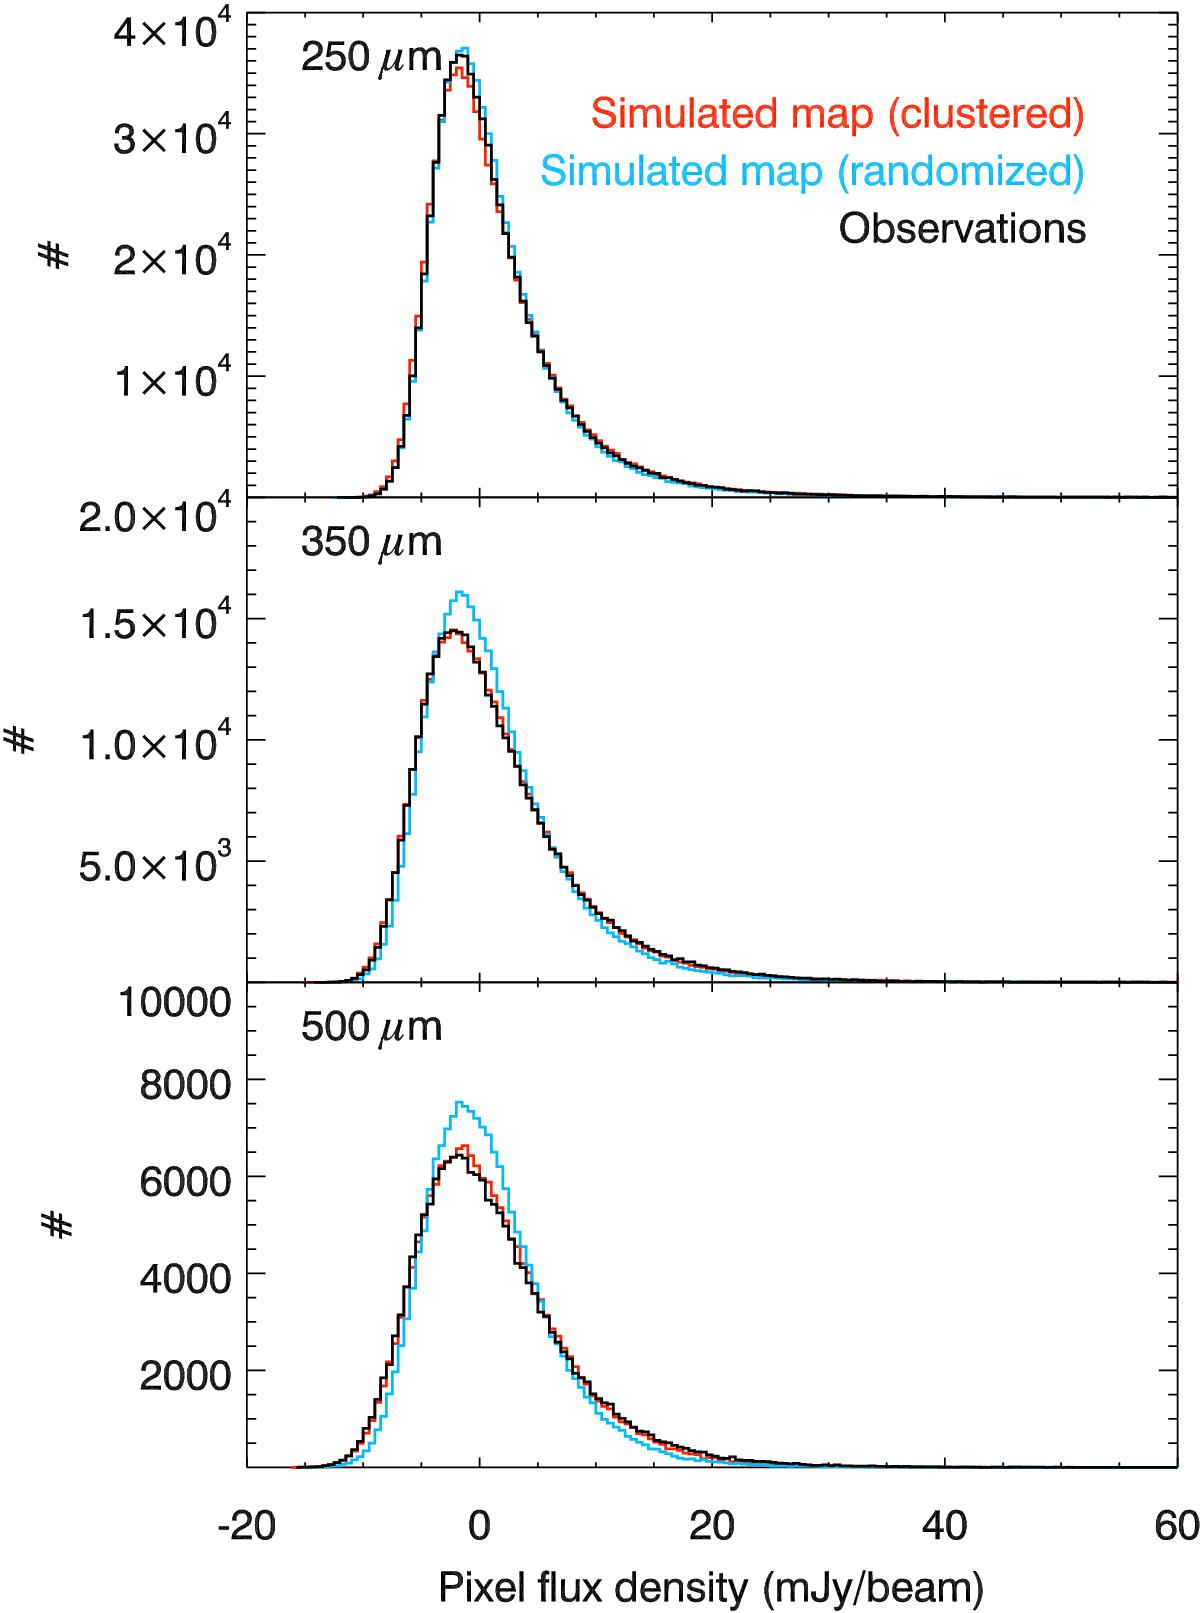
Pixel histograms of the Herschel/SPIRE maps in COSMOS (black) and comparison with our simulation using the same instrumental noise map. The red histograms are the result of our simulation and the blue ones are the histogram obtained after randomizing the position of the sources to illustrate the impact of clustering.
Current usage metrics show cumulative count of Article Views (full-text article views including HTML views, PDF and ePub downloads, according to the available data) and Abstracts Views on Vision4Press platform.
Data correspond to usage on the plateform after 2015. The current usage metrics is available 48-96 hours after online publication and is updated daily on week days.
Initial download of the metrics may take a while.