Fig. 1
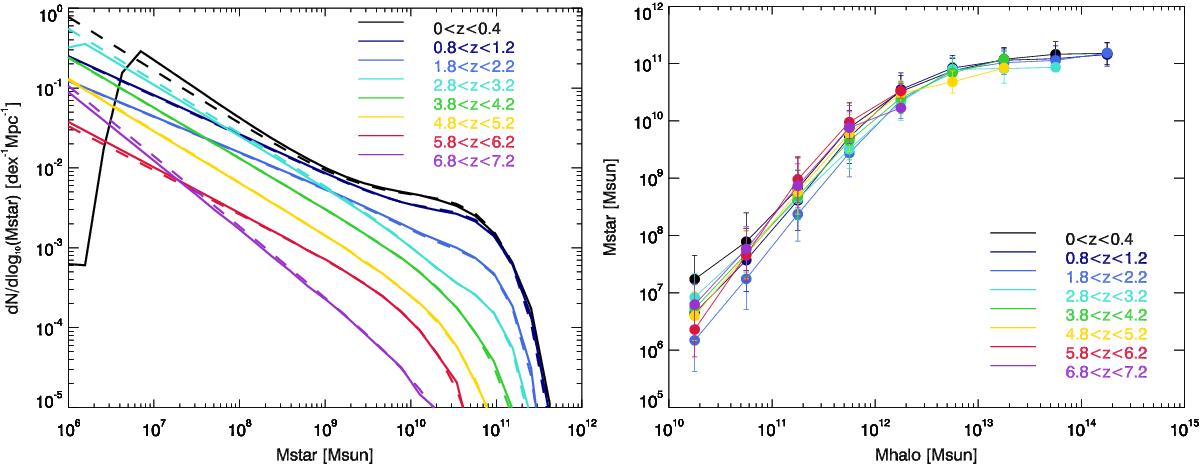
Left: evolution of the stellar mass function used in our simulation with redshift. The construction of this stellar mass function is explained in Sect. 2.2. The solid line is the SMF computed from the catalog in a bin Δz = 0.4. The dashed line is the analytic SMF at the mean redshift of the bin. The cut at low mass (M⋆< 107 M⊙) is due to the halo mass limit of the dark-matter simulation. Right: relation between the halo mass and the stellar mass from our abundance-matching procedure (see Sect. 2.3). The error bar indicates the 0.2 dex scatter on this relation.
Current usage metrics show cumulative count of Article Views (full-text article views including HTML views, PDF and ePub downloads, according to the available data) and Abstracts Views on Vision4Press platform.
Data correspond to usage on the plateform after 2015. The current usage metrics is available 48-96 hours after online publication and is updated daily on week days.
Initial download of the metrics may take a while.