Fig. 5
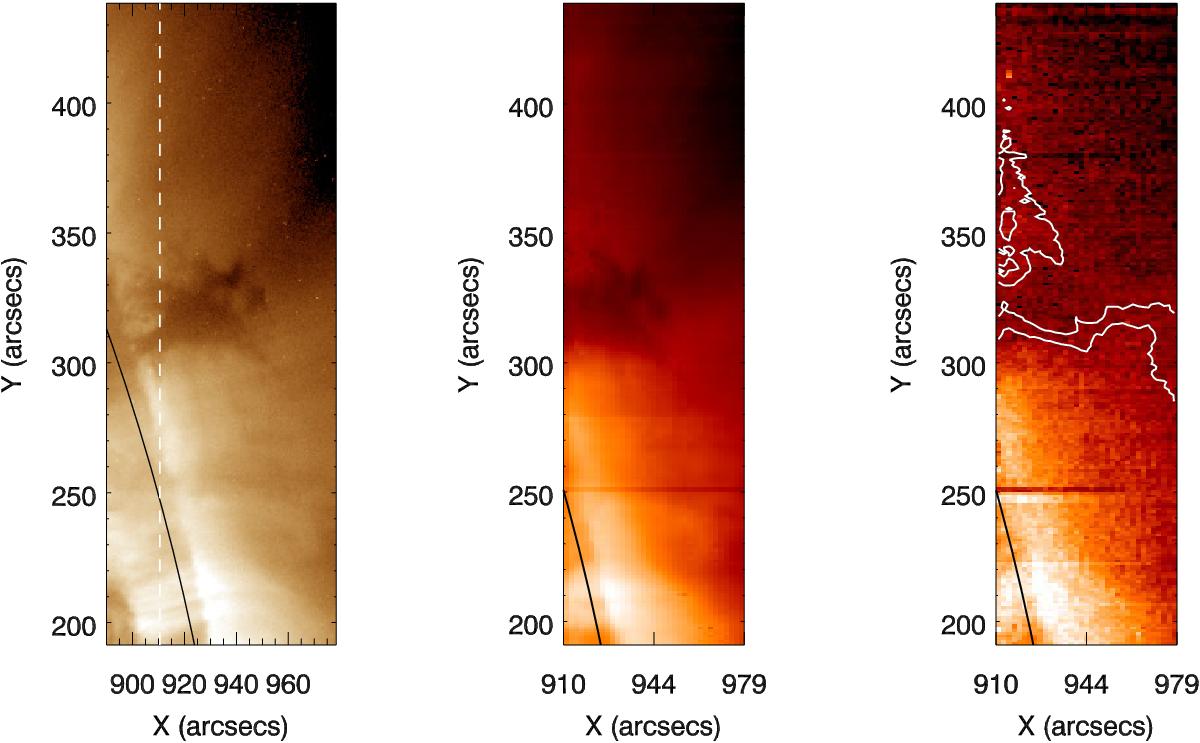
Maps from the 15 July 2014 for Fe xii lines, showing views of the prominence by AIA and EIS. Left: AIA 193 Å filter. Vertical dashed line shows the edge of the EIS FOV. Middle: EIS 195.119 Å. Right: EIS 195.179 Å with 22% and 25% contours of 195.119 Å (this line pair is used for density diagnostics in Sect. 5). The observations were made at 10:34 UT. The dark horizontal features in the EIS maps are artifacts from the EIS detectors.
Current usage metrics show cumulative count of Article Views (full-text article views including HTML views, PDF and ePub downloads, according to the available data) and Abstracts Views on Vision4Press platform.
Data correspond to usage on the plateform after 2015. The current usage metrics is available 48-96 hours after online publication and is updated daily on week days.
Initial download of the metrics may take a while.