Free Access
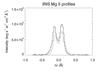
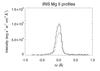
Fig. 3
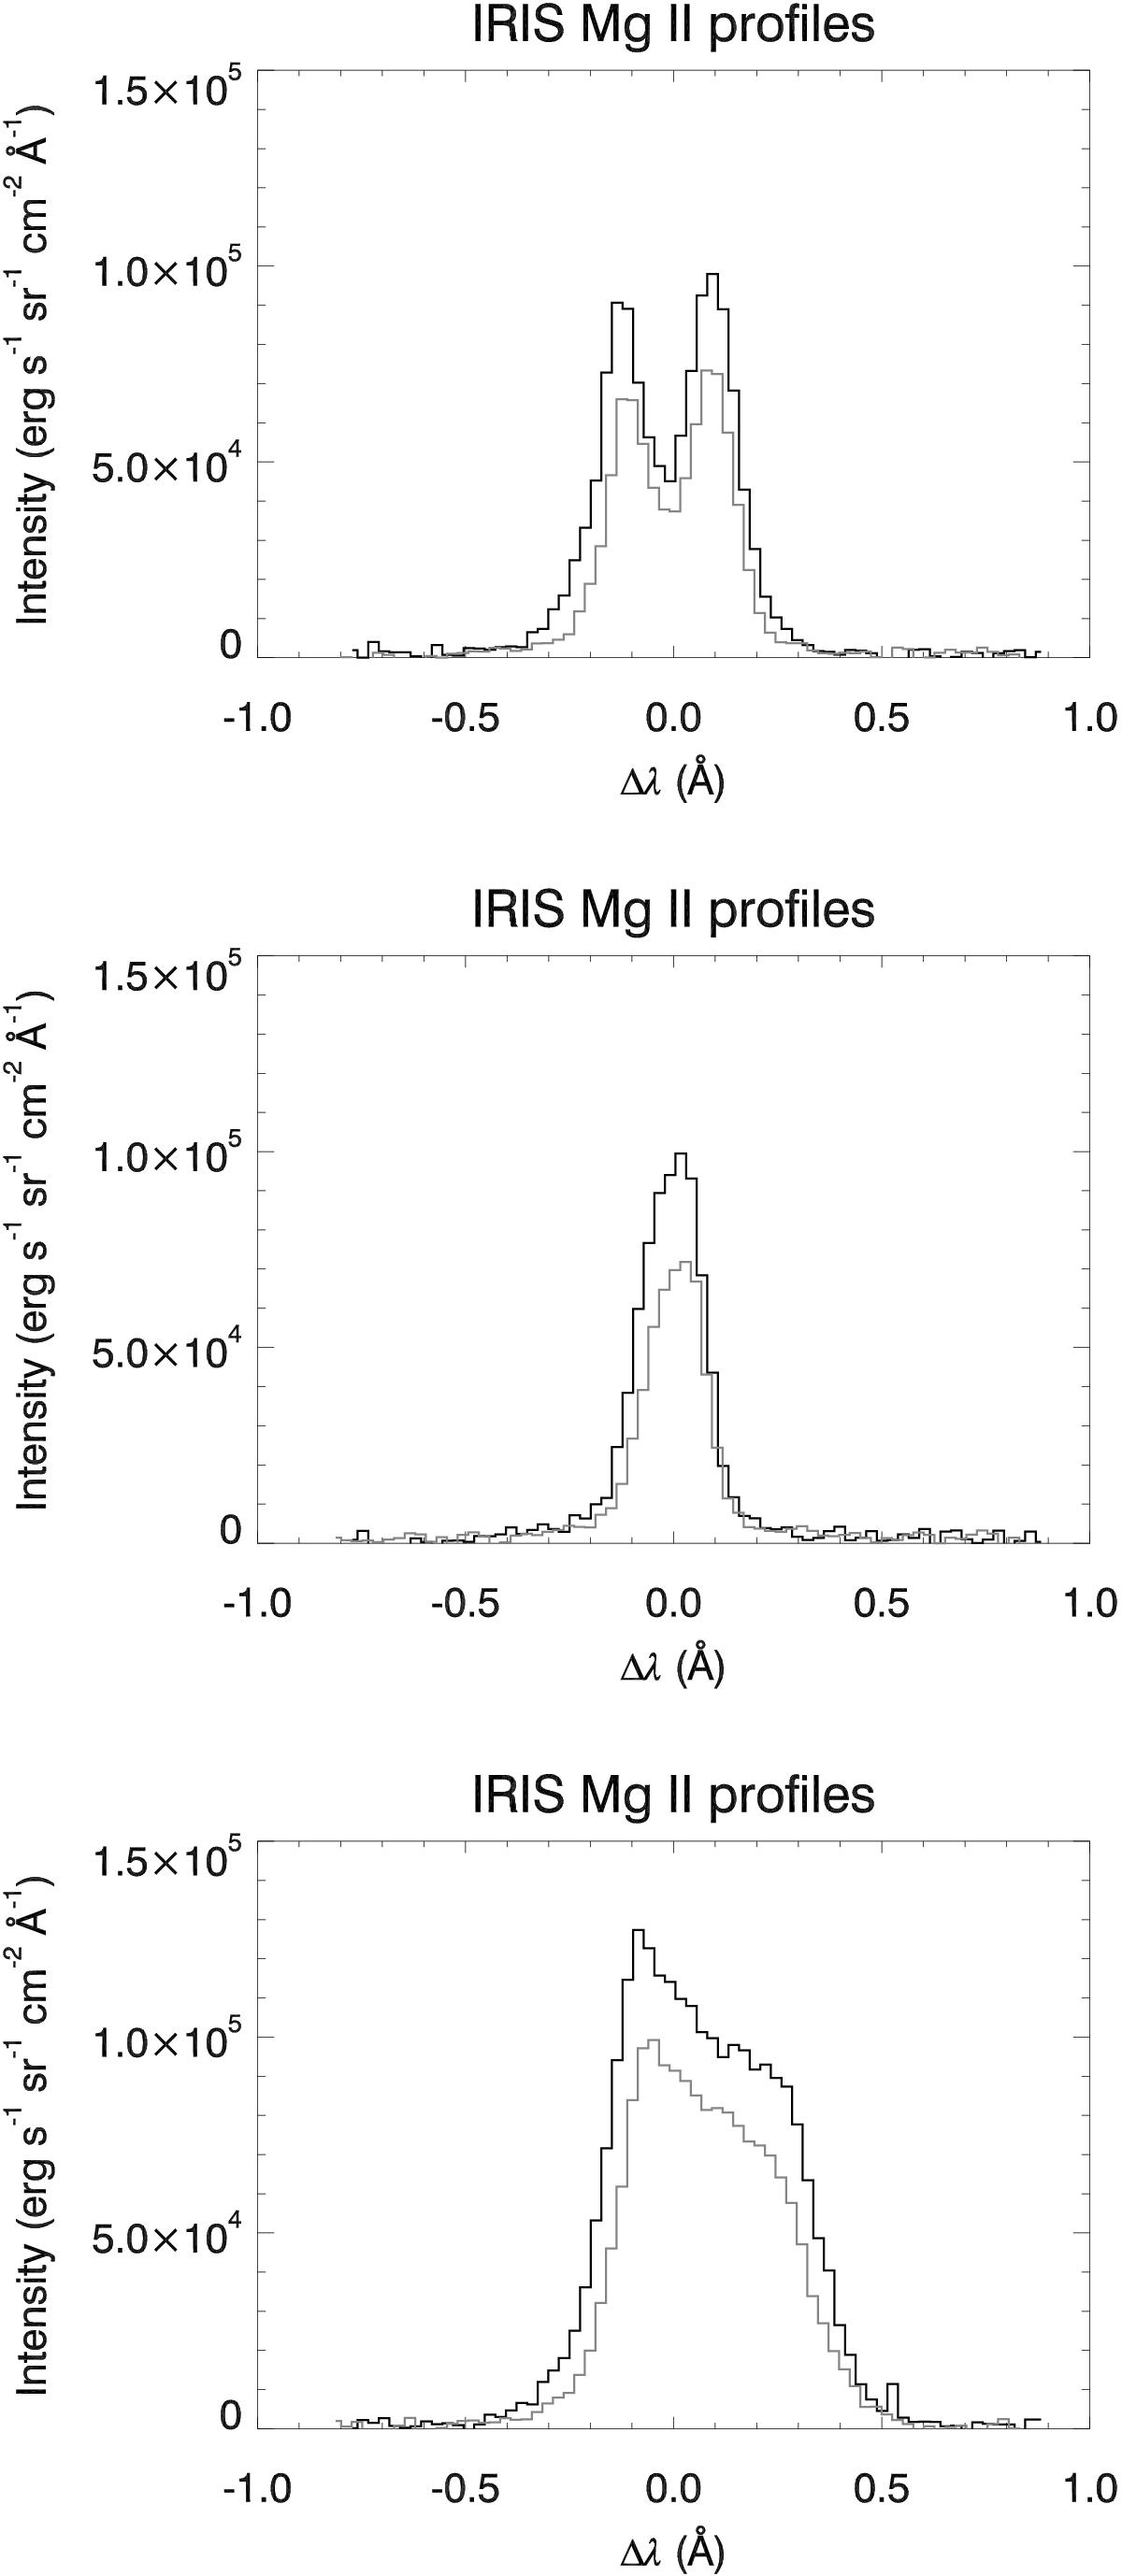
Example Mg ii k and h line profiles from the prominence of 15 July 2014. Each is taken from the raster that started at 10:21 UT. Shown are both k (black lines) and h (grey lines) profiles. Top: reversed profiles. Middle: single-peaked profiles. Bottom: complex profiles.
This figure is made of several images, please see below:
Current usage metrics show cumulative count of Article Views (full-text article views including HTML views, PDF and ePub downloads, according to the available data) and Abstracts Views on Vision4Press platform.
Data correspond to usage on the plateform after 2015. The current usage metrics is available 48-96 hours after online publication and is updated daily on week days.
Initial download of the metrics may take a while.