Free Access
Fig. 13
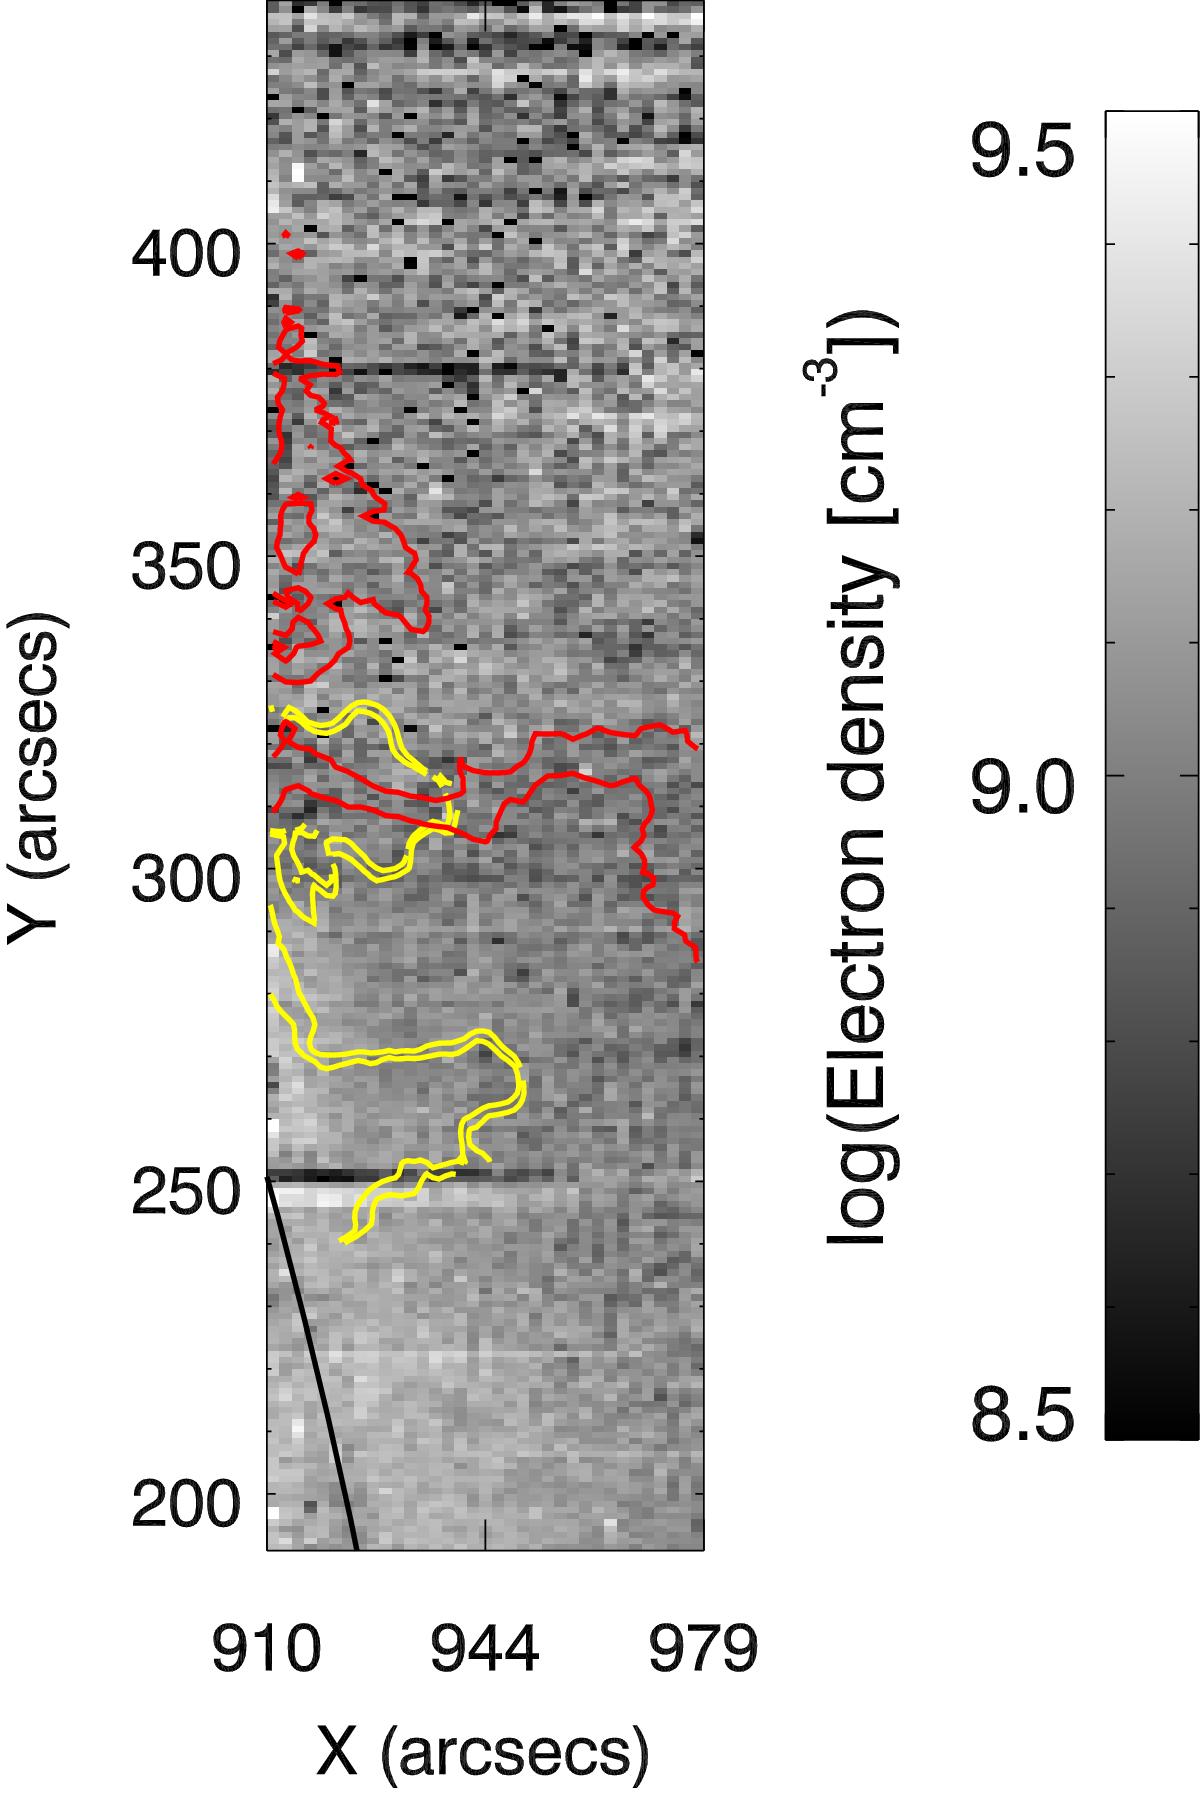
Density map of the prominence region using the density sensitive Fe xii lines at 195.119 Å and 195.179 Å. Yellow contours show outlines of the tornadoes as seen by THEMIS. Red contours are 22% and 25% of the EIS 195.119 Å intensity, the same as the white contours in Fig. 5. Black line shows the solar limb position.
Current usage metrics show cumulative count of Article Views (full-text article views including HTML views, PDF and ePub downloads, according to the available data) and Abstracts Views on Vision4Press platform.
Data correspond to usage on the plateform after 2015. The current usage metrics is available 48-96 hours after online publication and is updated daily on week days.
Initial download of the metrics may take a while.