Fig. 4
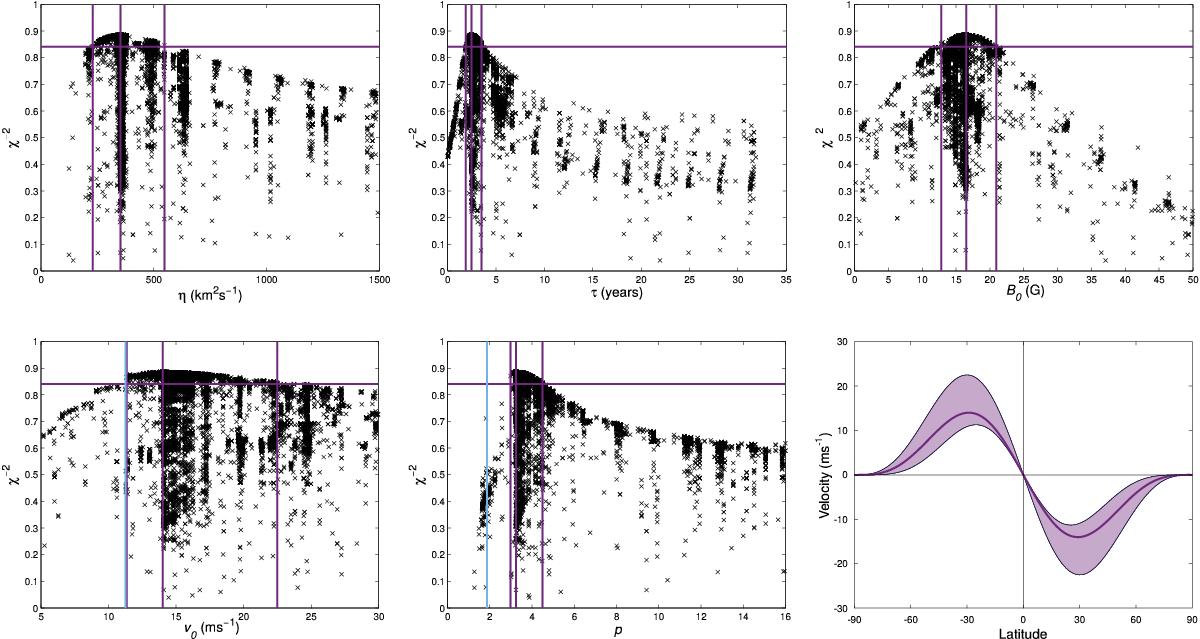
Scatter plots of every population member for each parameter. The horizontal purple line denotes 95% of the maximum χ-2. The central vertical purple line is the optimum value for each parameter, with error bars given by the neighbouring vertical purple lines. The vertical blue lines in the bottom left and middle panels are the values obtained from fitting the velocity profile in Eq. (3) to observational data (see Sect. 4). The bottom right panel shows the optimal meridional flow profile (bold purple) with acceptable profiles represented by the surrounding purple shading.
Current usage metrics show cumulative count of Article Views (full-text article views including HTML views, PDF and ePub downloads, according to the available data) and Abstracts Views on Vision4Press platform.
Data correspond to usage on the plateform after 2015. The current usage metrics is available 48-96 hours after online publication and is updated daily on week days.
Initial download of the metrics may take a while.