Fig. 9
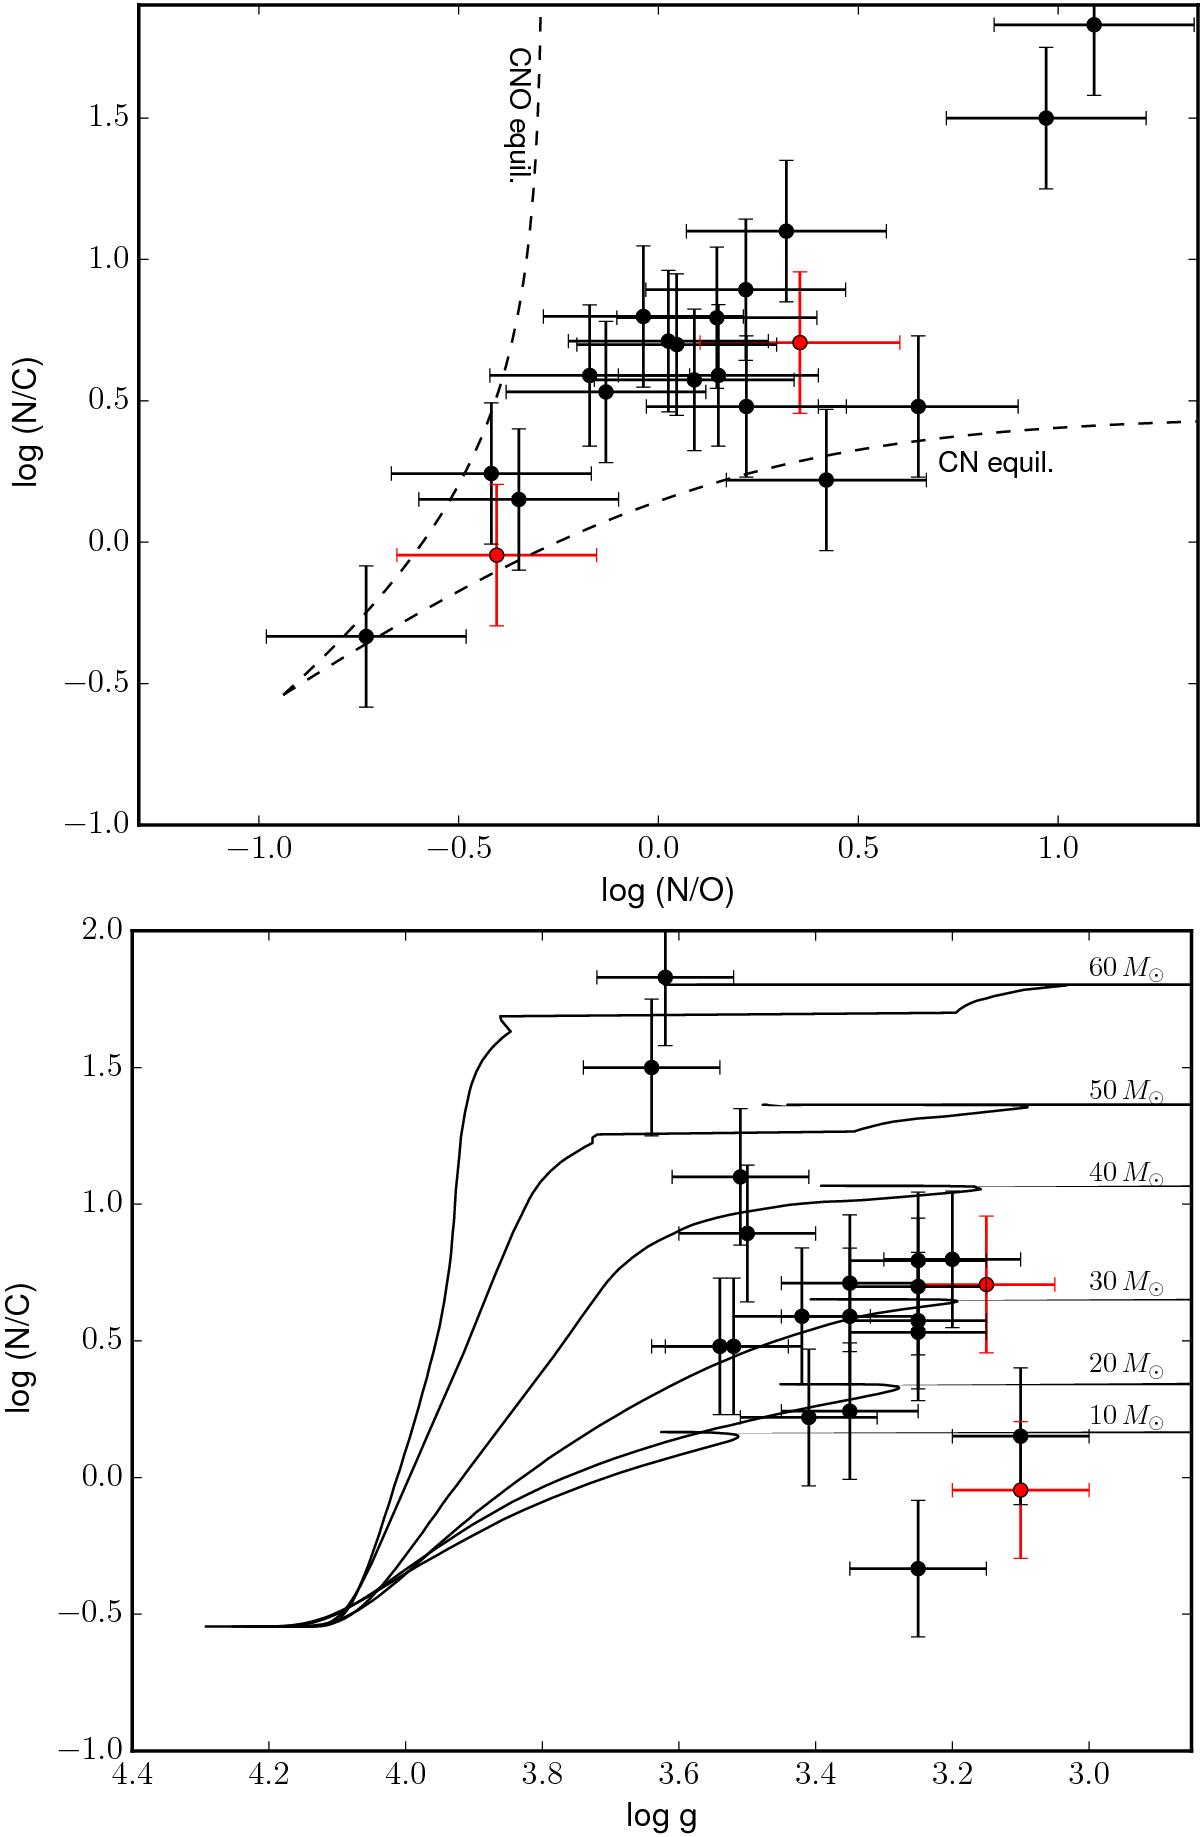
Top:log (N/C) (by number) as a function of log (N/O). The expected trends for the case of CN and CNO equilibrium are shown by the dashed lines. Bottom: log (N/C) (by number) as a function of log g. The two components of HD 166734 are represented by red dots, whilst the sample of Galactic supergiant stars analyzed by Bouret et al. (2012) and Martins et al. (2015) is represented by black dots. The evolutionary tracks are from Ekström et al. (2012) and are computed for a rotational rate (initial over critical) of 0.4. We use evolutionary tracks with initial masses larger than 10 M⊙.
Current usage metrics show cumulative count of Article Views (full-text article views including HTML views, PDF and ePub downloads, according to the available data) and Abstracts Views on Vision4Press platform.
Data correspond to usage on the plateform after 2015. The current usage metrics is available 48-96 hours after online publication and is updated daily on week days.
Initial download of the metrics may take a while.