Fig. 9
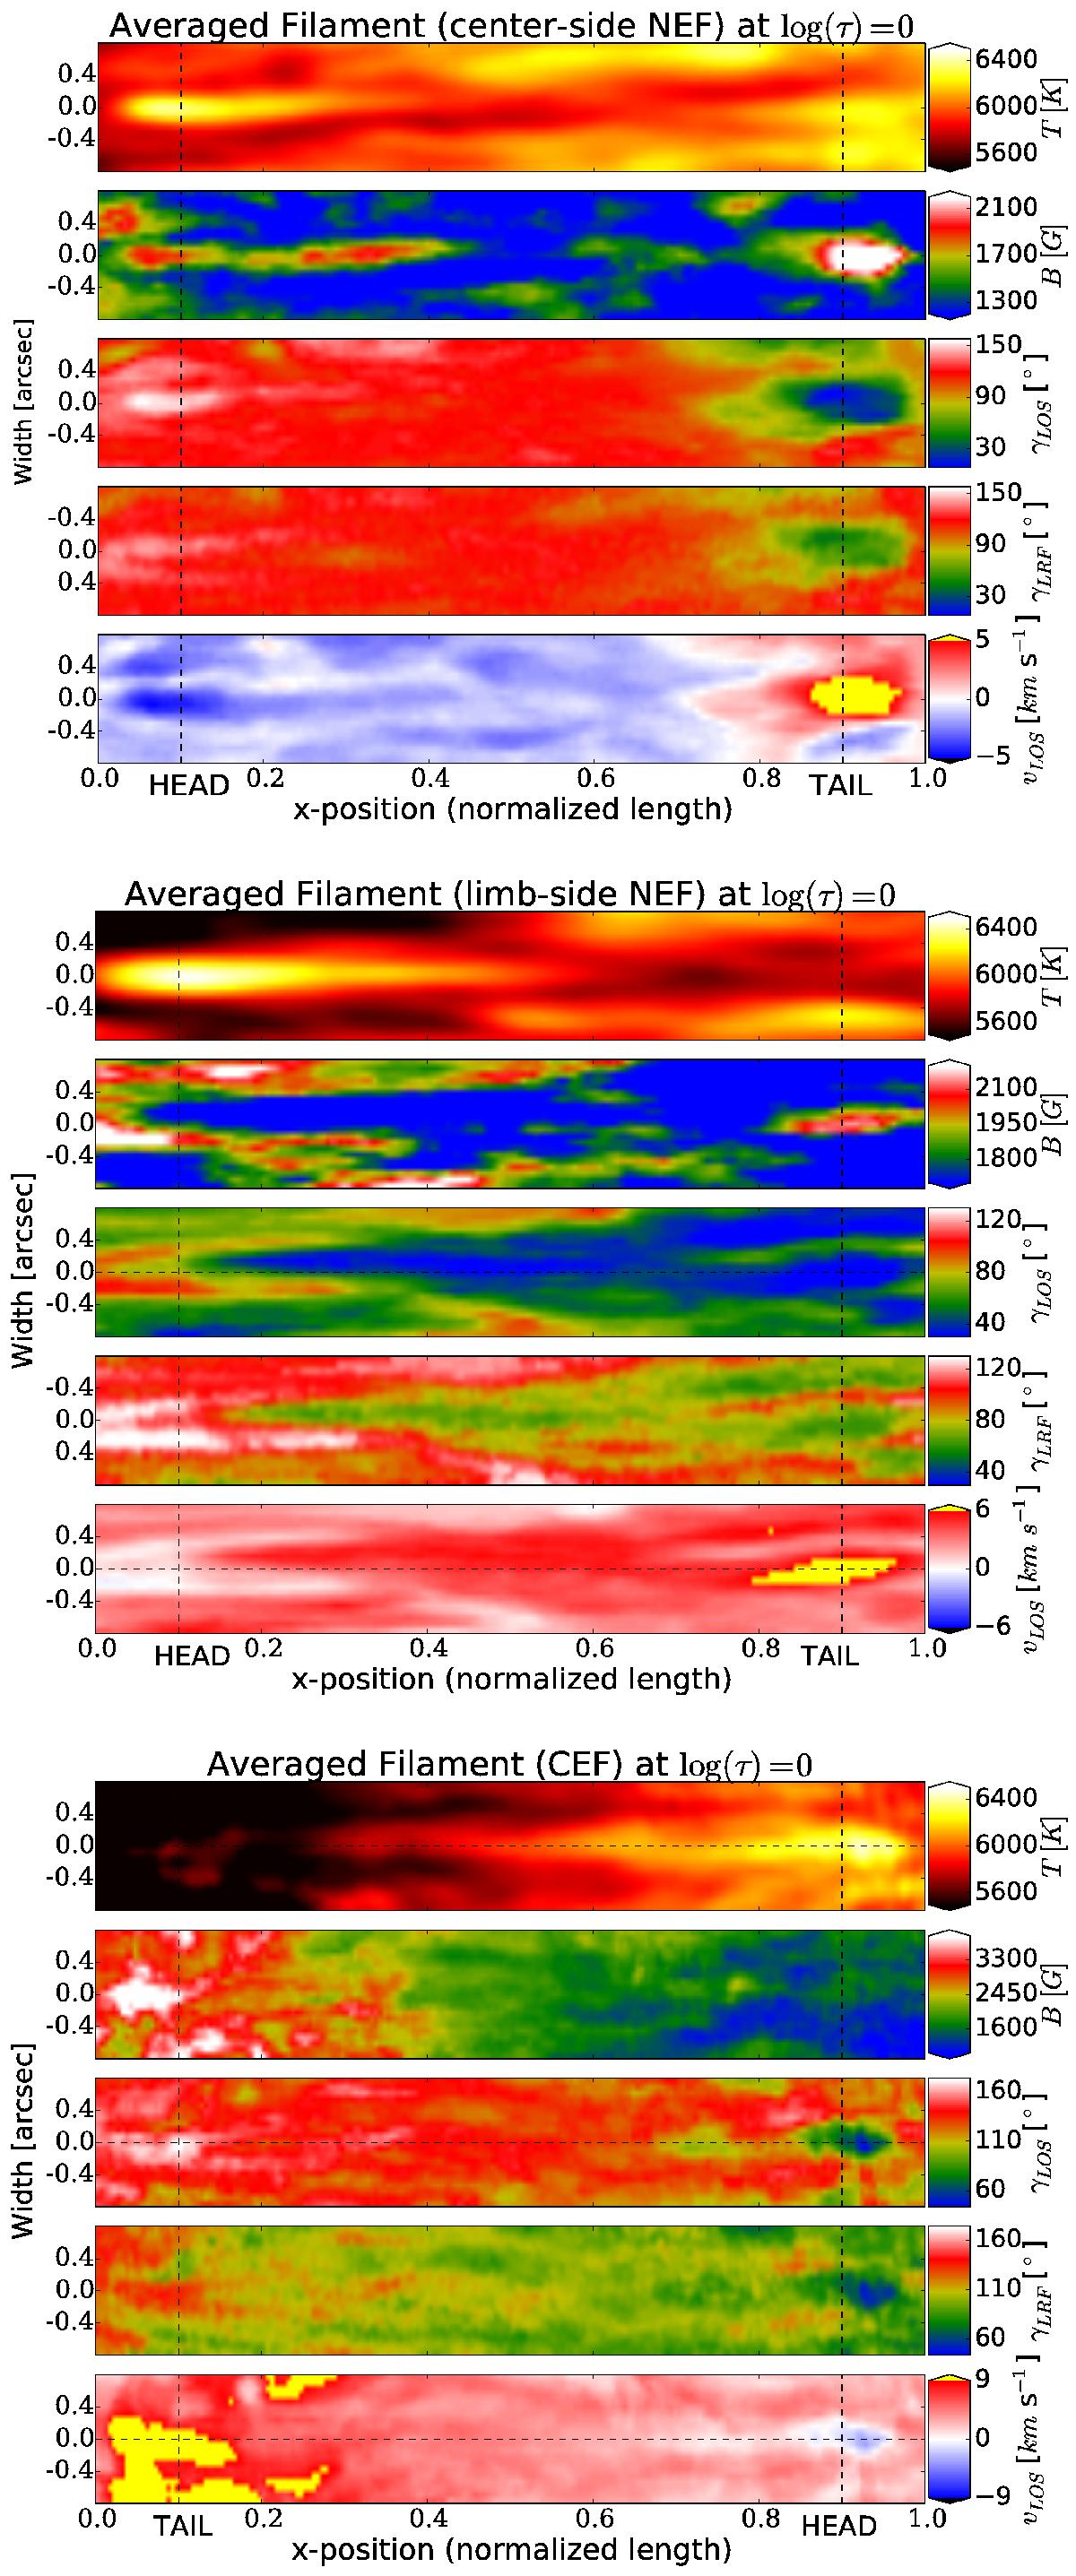
Average filaments from the center-side NEF (upper set of panels), limb-side NEF (middle panels) and CEF (lower panels) region. Subplots, that is, the set of five panels depicting filaments of a particular penumbral region, are in the same format as plots in Fig. 7. The head of CEF filament appears located on the right, while the NEF filaments are plotted with their heads on the left, that is, the filaments are plotted such that the part closer to the umbra is on the left for all three cases.
Current usage metrics show cumulative count of Article Views (full-text article views including HTML views, PDF and ePub downloads, according to the available data) and Abstracts Views on Vision4Press platform.
Data correspond to usage on the plateform after 2015. The current usage metrics is available 48-96 hours after online publication and is updated daily on week days.
Initial download of the metrics may take a while.