Fig. 7
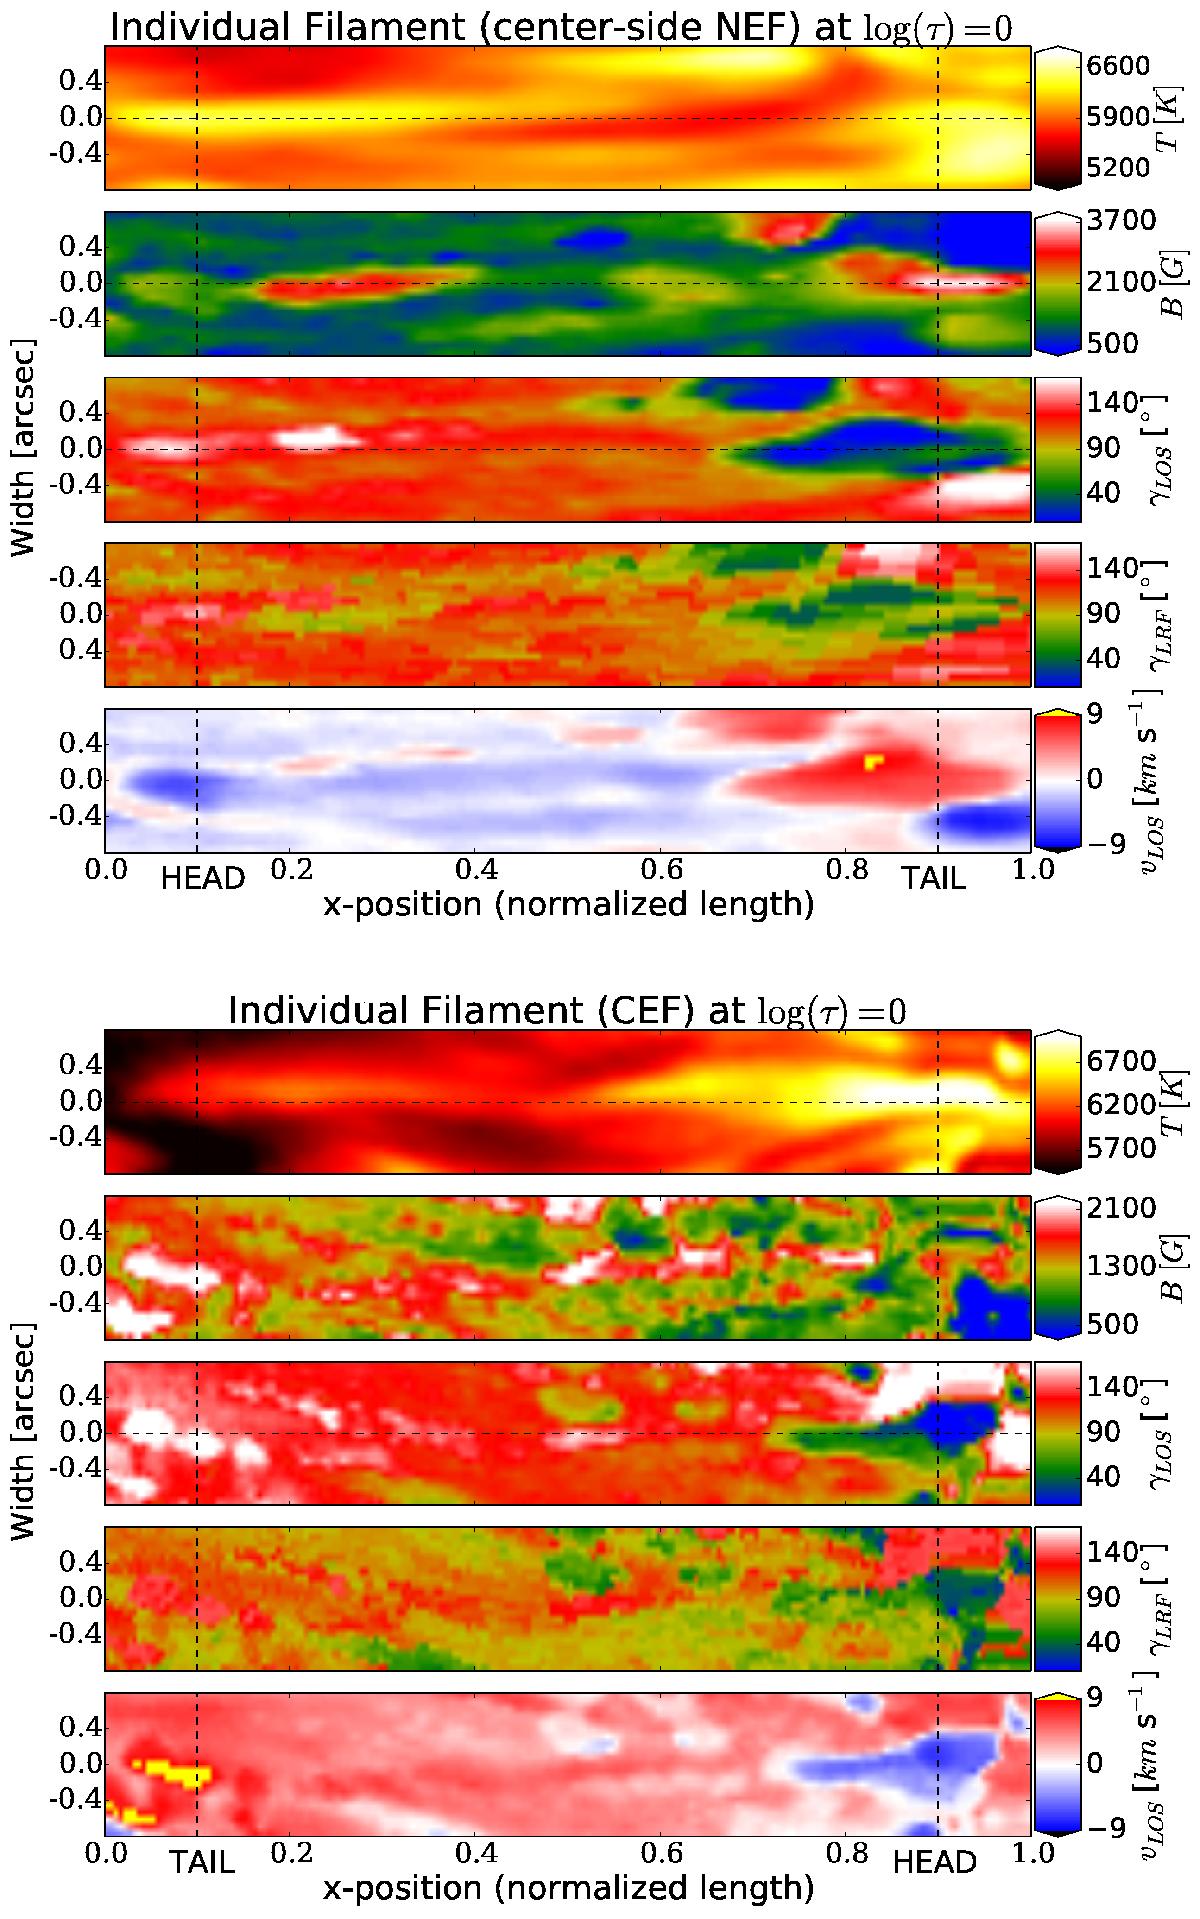
Individual filaments carrying a NEF (top) and a CEF (bottom) in their de-stretched and scaled form as seen at log (τ) = 0. Subplots show, from top to bottom: the temperature T, magnetic field strength B, field inclination in the line-of-sight γLOS and in the local reference frame γLRF, and the line-of-sight velocity vLOS. The vertical dashed lines indicate transversal cuts close to the filament’s endpoints: inner or closer to the umbra (left) and outer or closer to quiet sun (right). “Head” refers to the footpoint harboring an upflow, “tail” to the footpoint showing a downflow. The horizontal dashed lines indicate the de-stretched and length-normalized axis of the filament. The color-bars for a given parameter do not always have the same range for both maps of a given physical parameter and some of them have been saturated to highlight some patterns.
Current usage metrics show cumulative count of Article Views (full-text article views including HTML views, PDF and ePub downloads, according to the available data) and Abstracts Views on Vision4Press platform.
Data correspond to usage on the plateform after 2015. The current usage metrics is available 48-96 hours after online publication and is updated daily on week days.
Initial download of the metrics may take a while.