Fig. 3
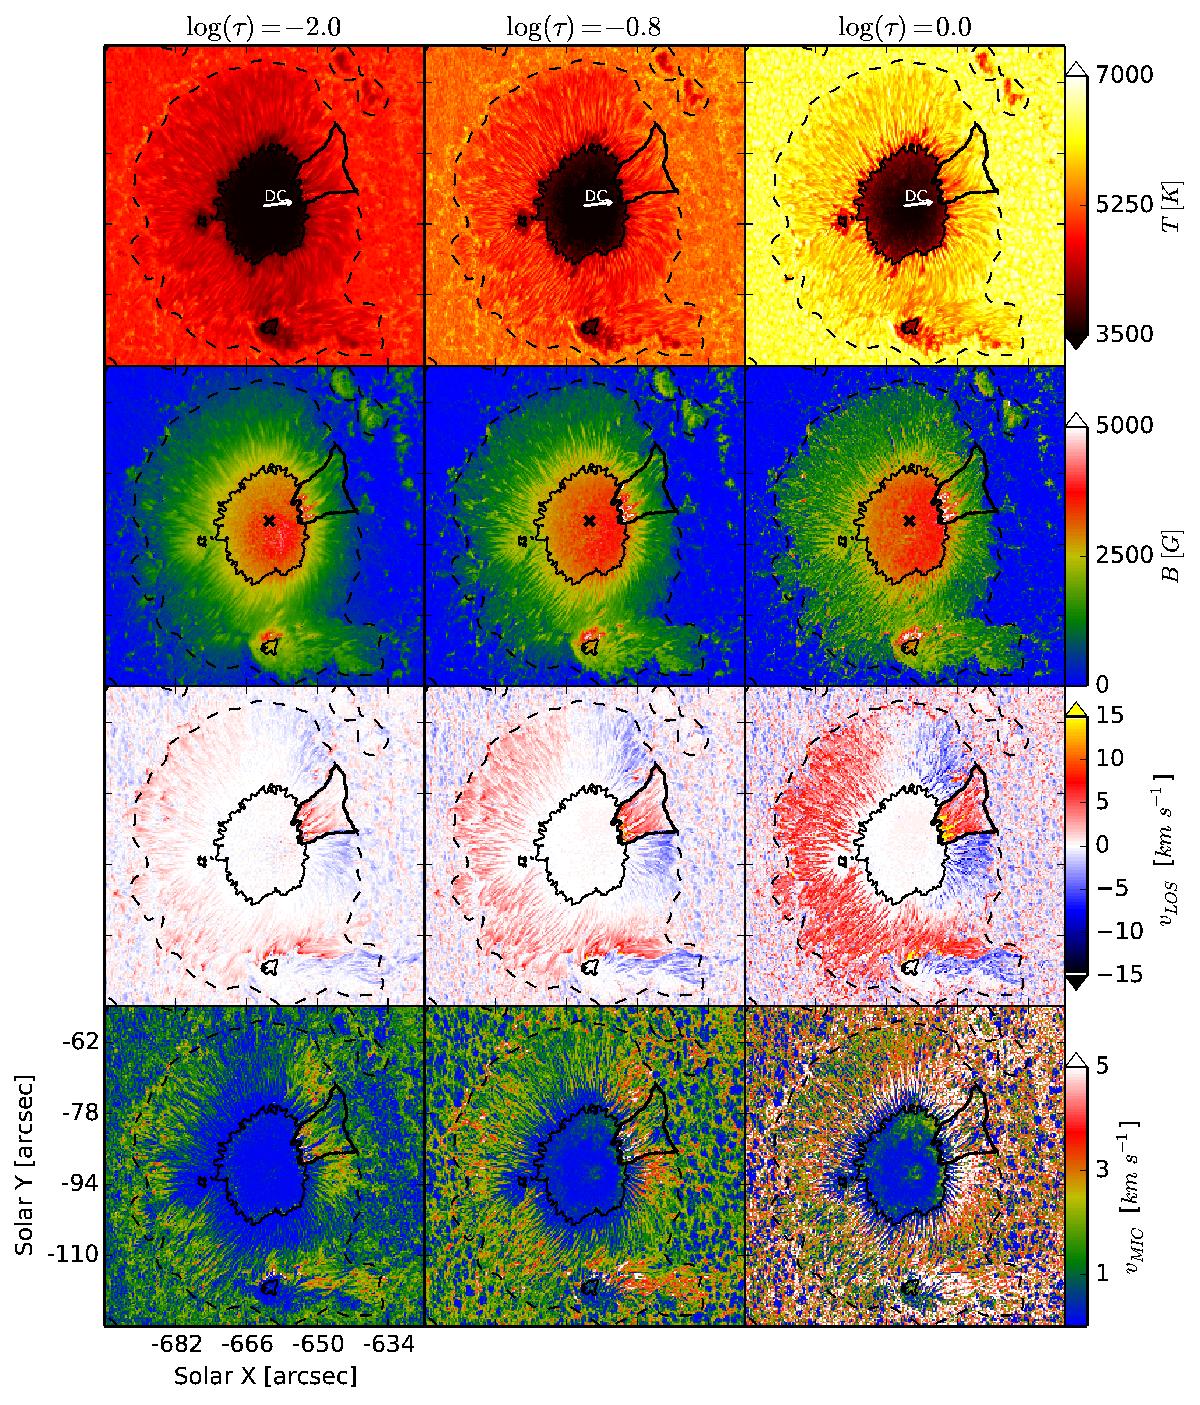
SPINOR 2D inverted parameters at three photospheric layers. From left to right: log (τ) = −2.0, −0.8 and 0. From top to bottom: temperature T (K); magnetic field intensity B (G); line-of-sight velocity vLOS (km s-1); and the micro-turbulence velocity vMIC (km s-1). In all maps, the black thick contour encloses a penumbral region where a counter EF is observed. The white arrows on the temperature maps point towards the disk center. Black crosses on the B maps indicate the location of a local maximum of the umbral field strength at log (τ) = 0. Also, the color-bar scale is sometimes saturated.
Current usage metrics show cumulative count of Article Views (full-text article views including HTML views, PDF and ePub downloads, according to the available data) and Abstracts Views on Vision4Press platform.
Data correspond to usage on the plateform after 2015. The current usage metrics is available 48-96 hours after online publication and is updated daily on week days.
Initial download of the metrics may take a while.