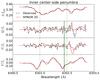
Fig. 2
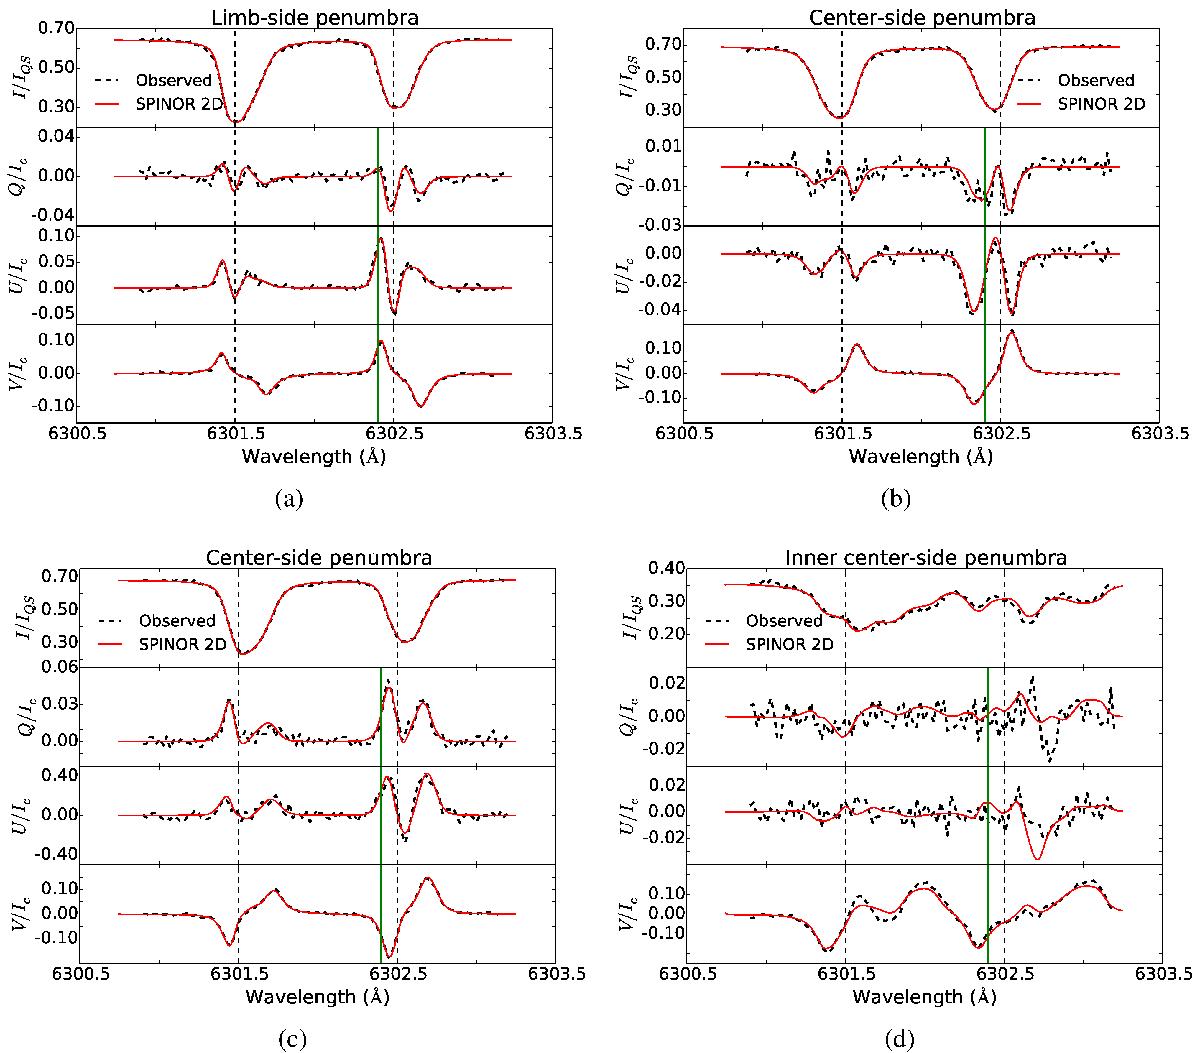
Observed Stokes profiles (dashed lines) and SPINOR 2D best-fits (solid red lines), in the wavelength interval 6300.90–6303.19 Å, at the location of the red markers shown in Fig. 1: panel a, from top to bottom: Stokes I/IQS, Q/Ic, U/Ic and V/Ic in a pixel from the limb-side penumbra (red “*” in Fig. 1); vertical green lines in the blue wing of 6302.5 Å indicate the selected wavelength used to construct the Stokes Q/Ic, U/Ic, and V/Ic maps in Fig. 1 (−0.1 Å from 6302.5 Å line core). Vertical dashed lines were placed at 6301.5Å and at 6302.5Å, respectively. Panels b, c, and d: Stokes profiles in three pixels from the center-side penumbra (red “x”, red “+” and yellow “+” in Fig. 1, respectively) in the same format as in panel a. The SPINOR 2D best fits of profiles in panel d give B ~ 6.4, 8.0 and 8.3 kG, γ ~ 141,148 and 145°, and vLOS ~ 5.6, 8.3 and 9.3 km s-1 at log (τ) = −2.0, −0.8 and 0, respectively, with χ2 = 14.
Current usage metrics show cumulative count of Article Views (full-text article views including HTML views, PDF and ePub downloads, according to the available data) and Abstracts Views on Vision4Press platform.
Data correspond to usage on the plateform after 2015. The current usage metrics is available 48-96 hours after online publication and is updated daily on week days.
Initial download of the metrics may take a while.