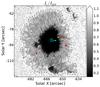
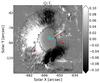
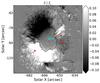
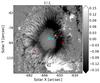
Fig. 1
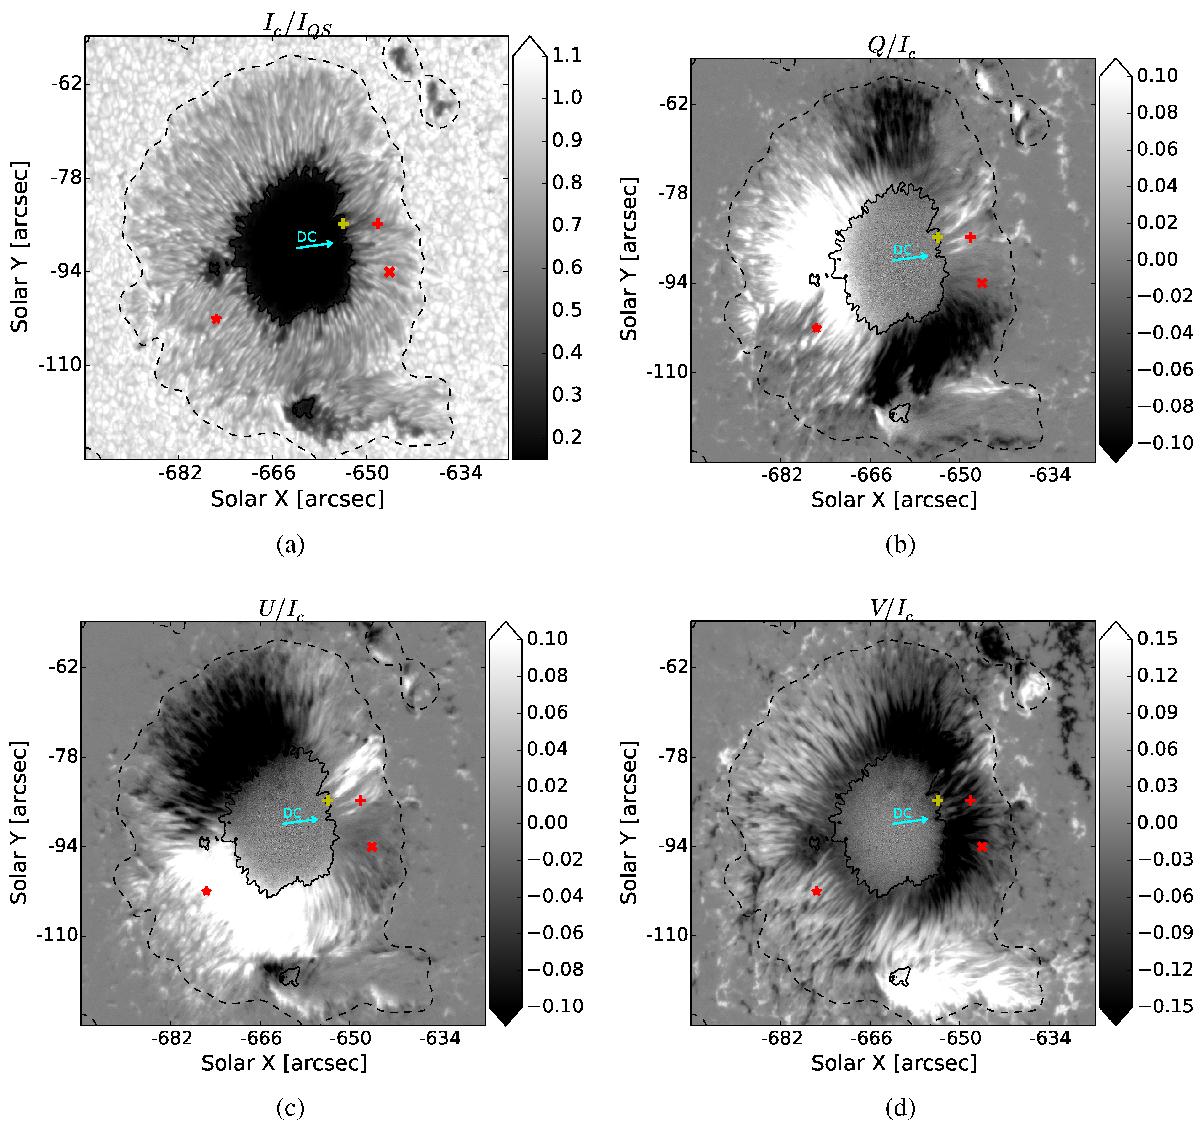
Stokes maps observed by the Hinode SOT/SP in the main sunspot of the NOAA AR 10930 on December 08, 2006. Panel a: continuum intensity Ic normalized to the mean continuum value in the quiet sun, IQS. Panels b, c, and d: maps of the Stokes parameters Q, U, and V, respectively, normalized to local Ic. The Stokes Q, U and V maps were constructed at −0.1 Å from the 6302.5 Å line core (the selected wavelength is indicated by vertical green lines in Fig. 2). The umbra-penumbra boundary (black solid contour) was placed at Ic/IQS = 0.26 and the external penumbral boundary (black dashed contour) is at Ic/IQS = 0.94. The cyan arrows point towards the disk center. Red markers show three selected pixels, one located in the limb-side penumbra (“*”), and two located in the center-side penumbra (“x” and “+”, respectively); their corresponding Stokes profiles are shown in Figs. 2a, b, and c, respectively. The yellow cross shows a pixel close to the inner penumbral boundary where the inversions give B> 7 kG at log (τ) = 0 and whose Stokes profiles are shown in Fig. 2d.
Current usage metrics show cumulative count of Article Views (full-text article views including HTML views, PDF and ePub downloads, according to the available data) and Abstracts Views on Vision4Press platform.
Data correspond to usage on the plateform after 2015. The current usage metrics is available 48-96 hours after online publication and is updated daily on week days.
Initial download of the metrics may take a while.