Fig. 6
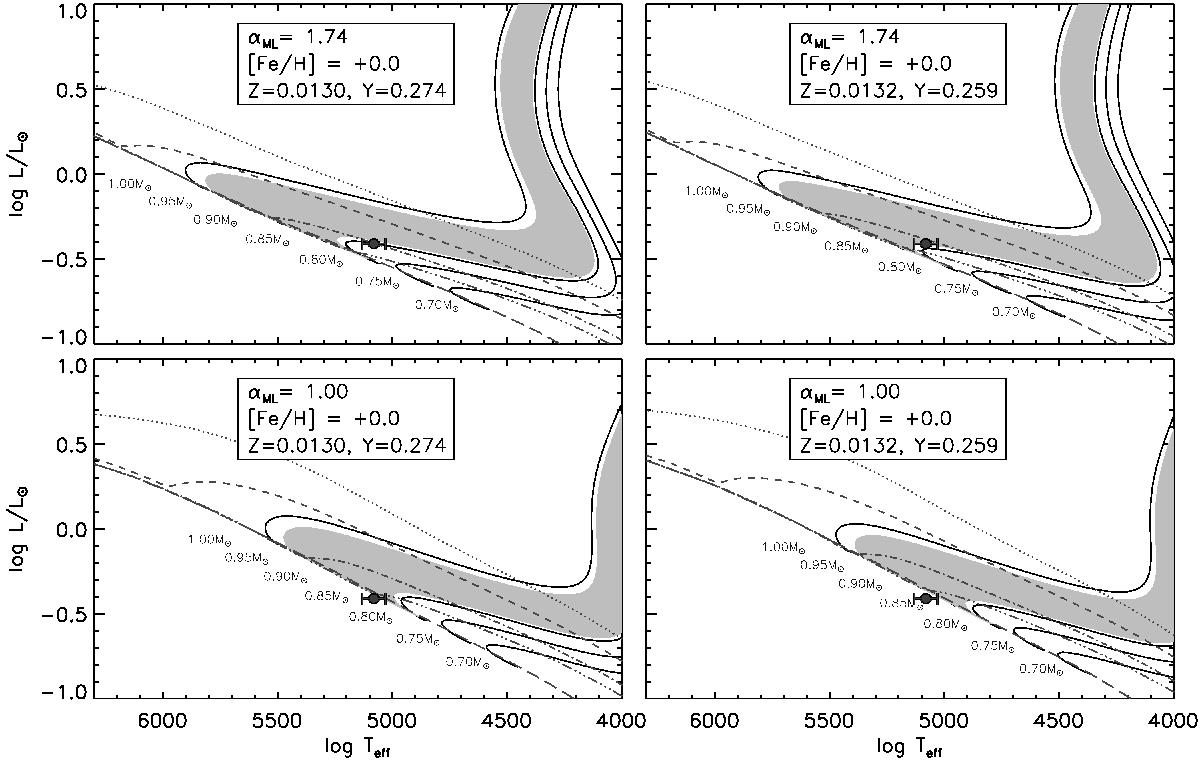
Comparison of AB Dor A with a set of PMS evolutionary tracks with [Fe/H] = 0 for different initial helium abundances (standard abundance, left panels; low abundance, right panels), and for different mixing length values αML (1.74, top panels; 1.00, bottom panels). The shaded area corresponds to the region between track with masses in 0.82−0.98 M⊙, as given by the uncertainty on dynamical mass.
Current usage metrics show cumulative count of Article Views (full-text article views including HTML views, PDF and ePub downloads, according to the available data) and Abstracts Views on Vision4Press platform.
Data correspond to usage on the plateform after 2015. The current usage metrics is available 48-96 hours after online publication and is updated daily on week days.
Initial download of the metrics may take a while.