Free Access
Fig. 6
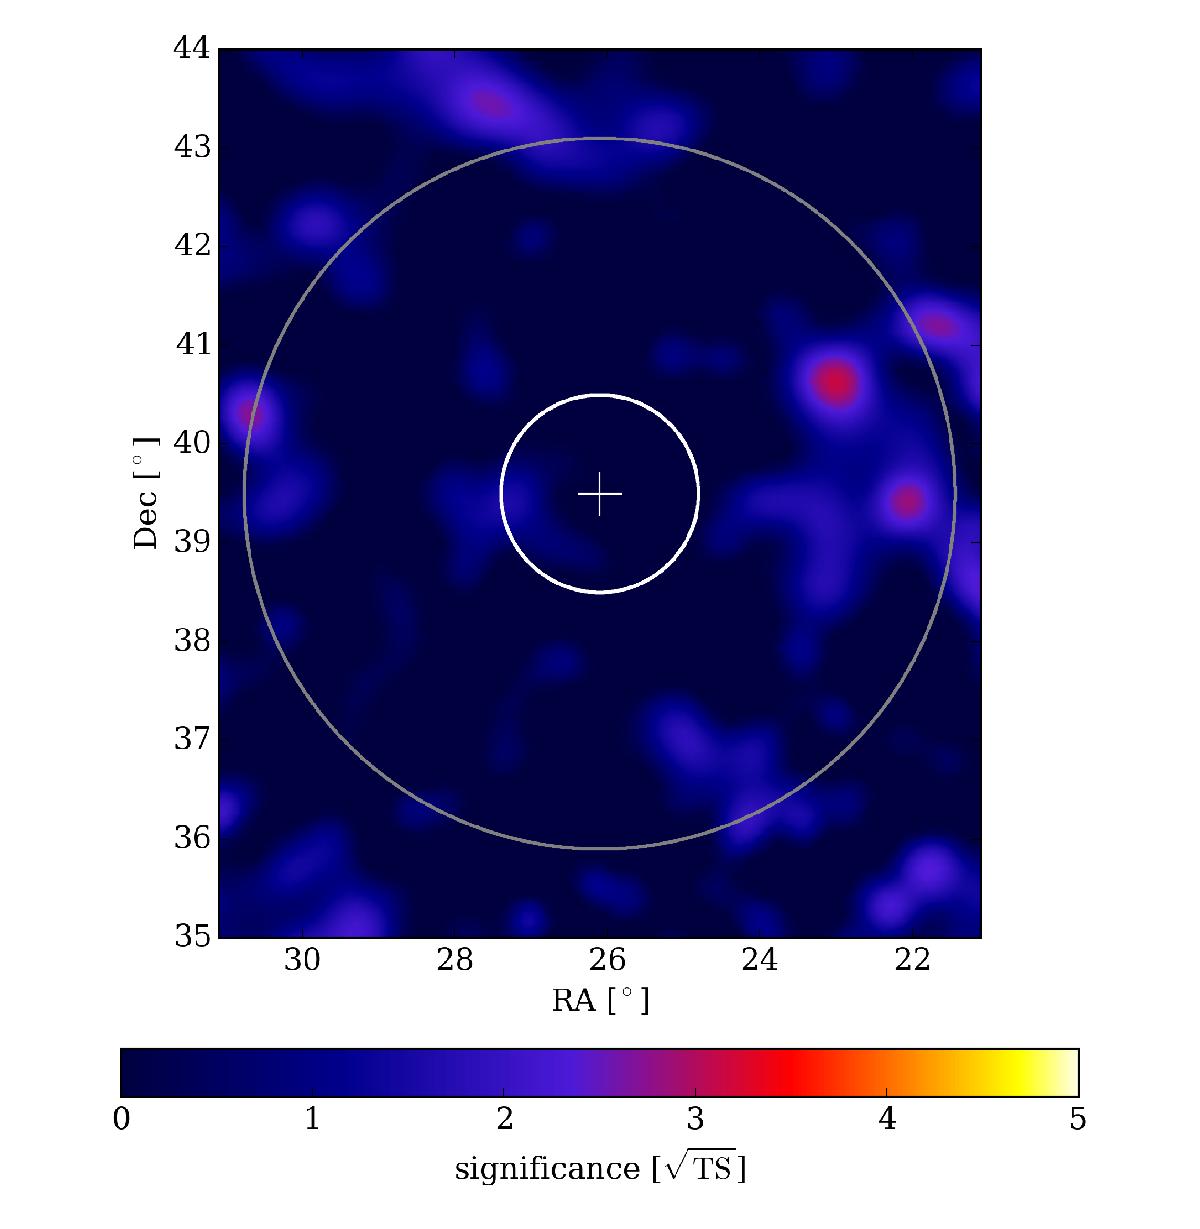
HAWC 500 GeV to 160 TeV significance sky map for data collected over one transit between 19:18 UTC on 2016-02-17 and 01:31 UTC on 2016-02-18, centered at RA = 26.1°, Dec = 39.5°. The IceCube 50% (white) and 90% (gray) error circles are also shown.
Current usage metrics show cumulative count of Article Views (full-text article views including HTML views, PDF and ePub downloads, according to the available data) and Abstracts Views on Vision4Press platform.
Data correspond to usage on the plateform after 2015. The current usage metrics is available 48-96 hours after online publication and is updated daily on week days.
Initial download of the metrics may take a while.