Fig. 10
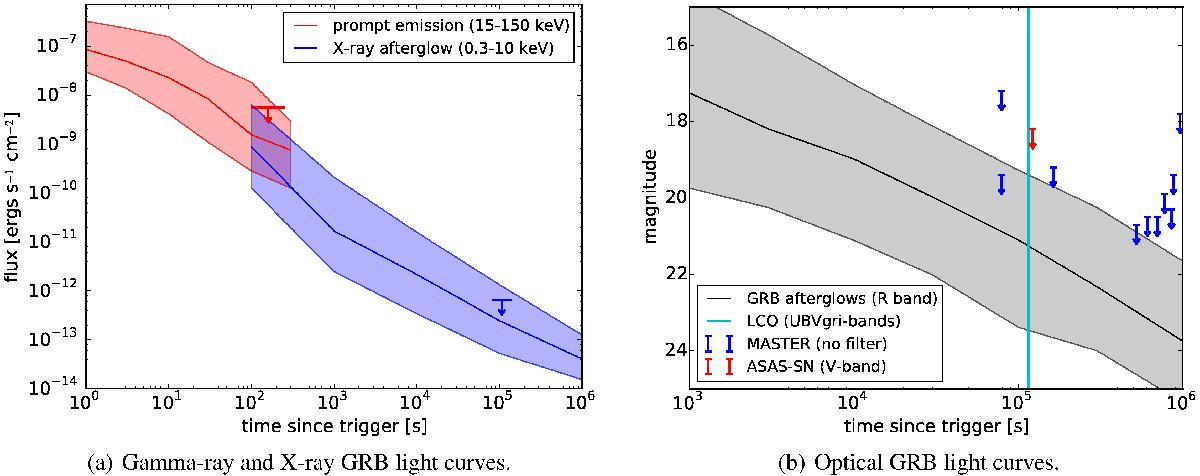
The shaded bands show the gamma-ray and X-ray light curves of detected GRBs (left) and optical afterglow light curves (right). The central line shows the median flux at the indicated time and the shaded bands include 80% of all GRBs (i.e., the 10% brightest and faintest afterglows are above or below the band, respectively). The arrows show the flux upper limits from the X-ray and optical follow-up observations (see Sects. 4.1 and 4.2 for details).
Current usage metrics show cumulative count of Article Views (full-text article views including HTML views, PDF and ePub downloads, according to the available data) and Abstracts Views on Vision4Press platform.
Data correspond to usage on the plateform after 2015. The current usage metrics is available 48-96 hours after online publication and is updated daily on week days.
Initial download of the metrics may take a while.