Fig. 4
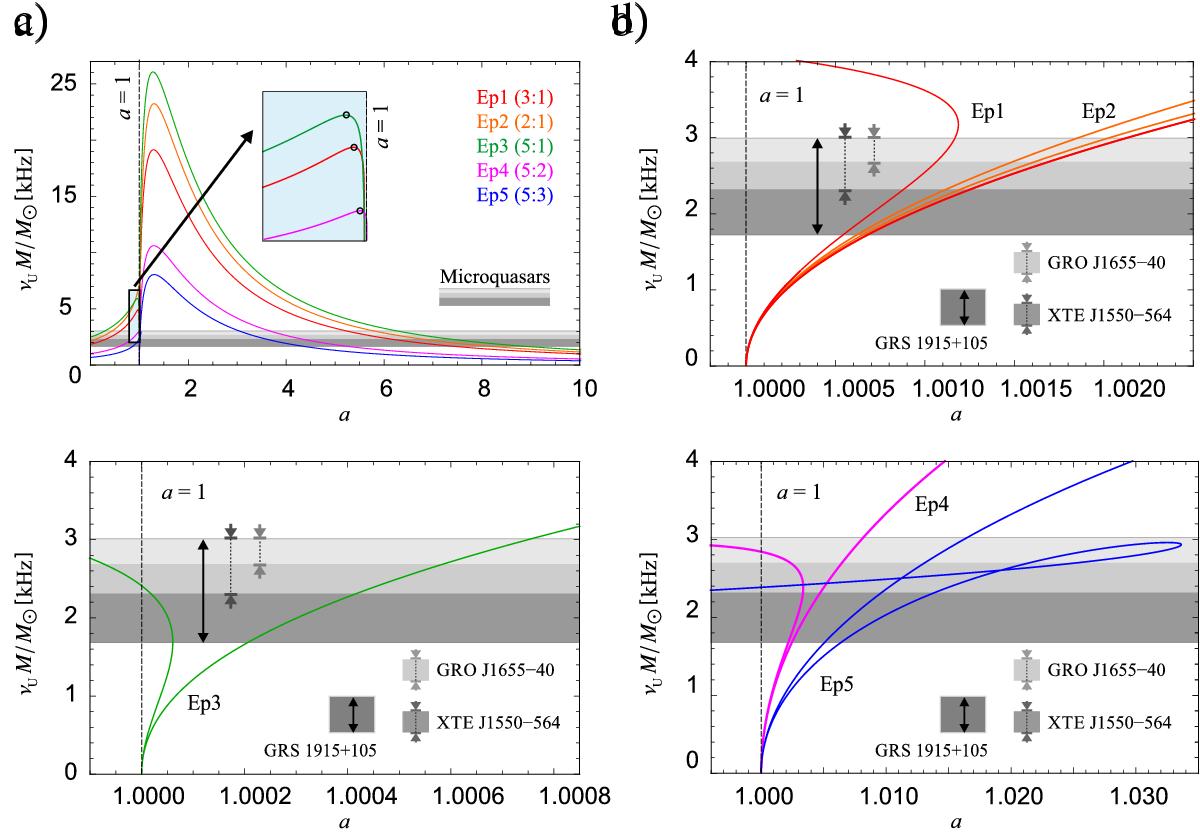
Resonant frequencies of the Ep models calculated in Kerr spacetimes. The enlarged area emphasizes the existence of maxima of the νU × M curves in the case of the Ep1, Ep3, and Ep4 models in BH spacetimes. The shaded region corresponds to the observational values of νU × M determined for Galactic microquasars (see Sect. 5 for discussion). Panel a: behaviour of resonant frequencies of the whole group of models on a large scale of a. Panel b: detailed view of behaviour of the resonant frequencies for the Ep1 and Ep2 models for a ≈ 1. The individual horizontal grey-scaled areas denote the observational values of νU × M determined for each of the Galactic microquasars. Panel c: detailed view of the behaviour of resonant frequencies for the Ep3 model for a ≈ 1. Panel d: detailed view of the behaviour of resonant frequencies for the Ep4 and Ep5 models for a ≈ 1.
Current usage metrics show cumulative count of Article Views (full-text article views including HTML views, PDF and ePub downloads, according to the available data) and Abstracts Views on Vision4Press platform.
Data correspond to usage on the plateform after 2015. The current usage metrics is available 48-96 hours after online publication and is updated daily on week days.
Initial download of the metrics may take a while.