Fig. 8
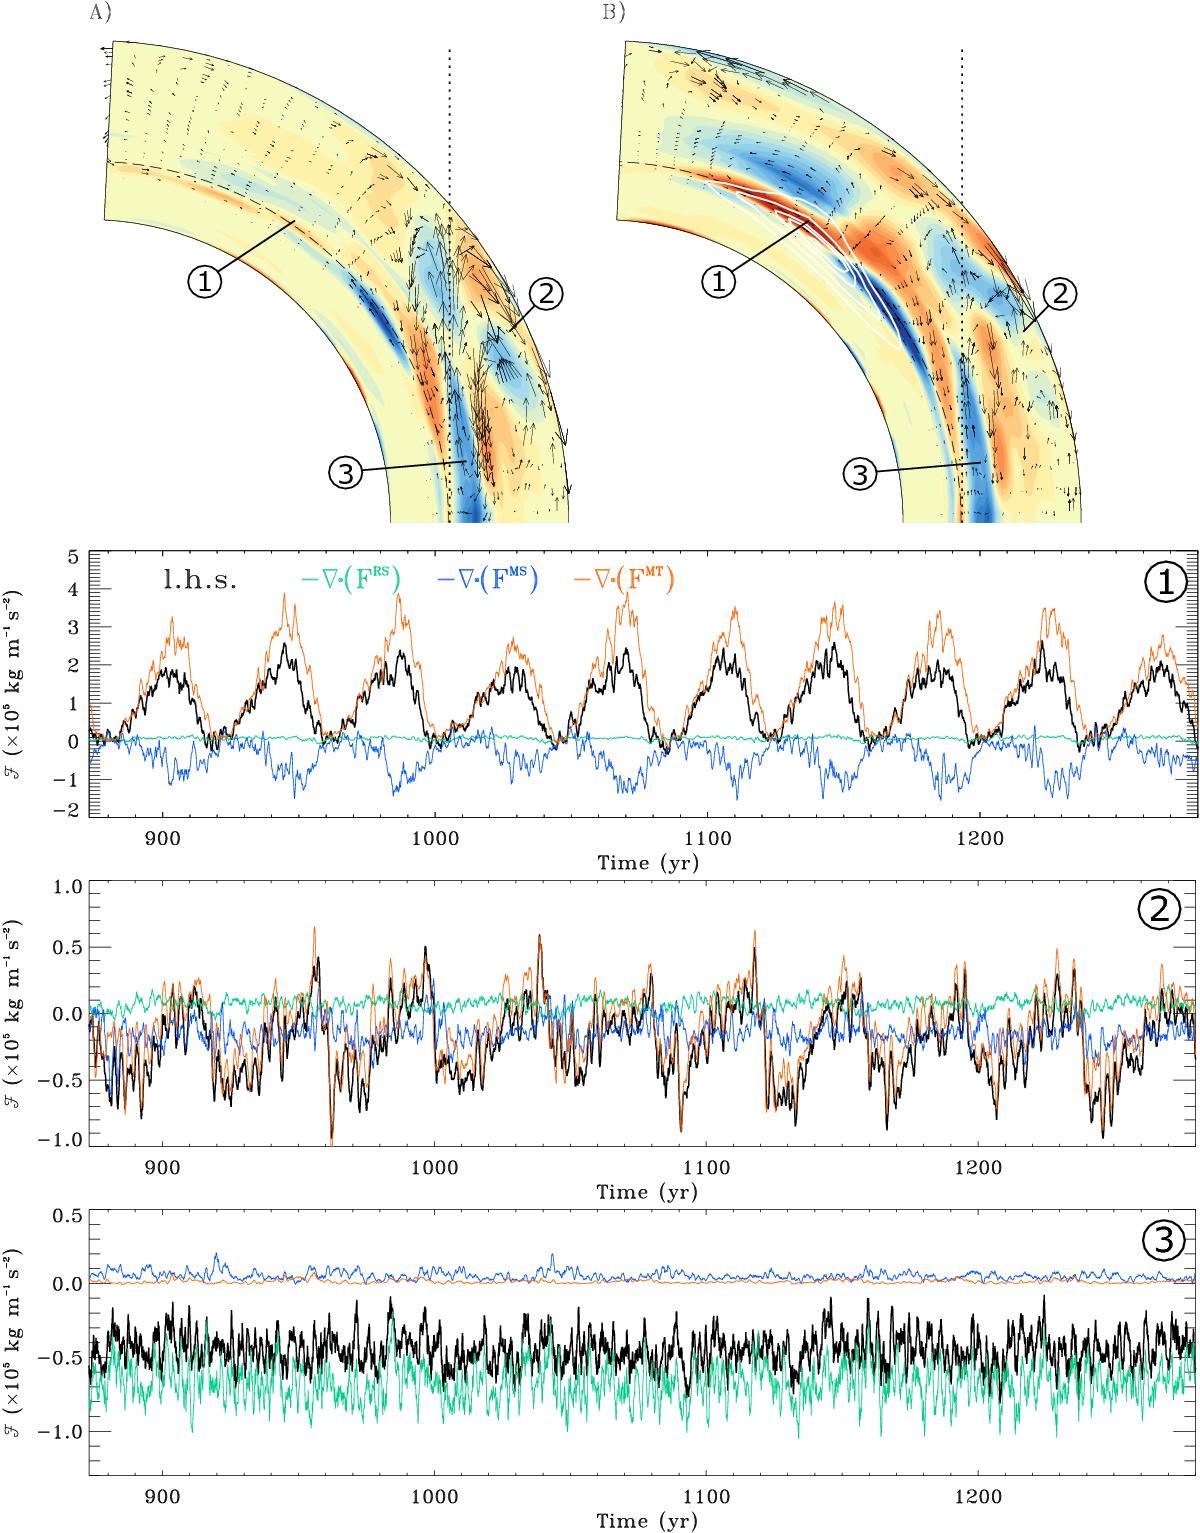
Panels A and B: right-hand side of Eq. (7) in the NH averaged over cycle minima and cycle maxima. The vector field represents the direction of the meridional flow and the vertical dotted line represents the TC. The white contour lines in B) show the area where the toroidal field accumulates at cycle maximum. The bottom panels show the time evolution of the left-hand side of Eq. (7) and the individual terms on the right-hand side (as labeled), sampled at the numbered locations. The data in the lower three panels were smoothed with a one-year average filter.
Current usage metrics show cumulative count of Article Views (full-text article views including HTML views, PDF and ePub downloads, according to the available data) and Abstracts Views on Vision4Press platform.
Data correspond to usage on the plateform after 2015. The current usage metrics is available 48-96 hours after online publication and is updated daily on week days.
Initial download of the metrics may take a while.