Free Access
Fig. 2
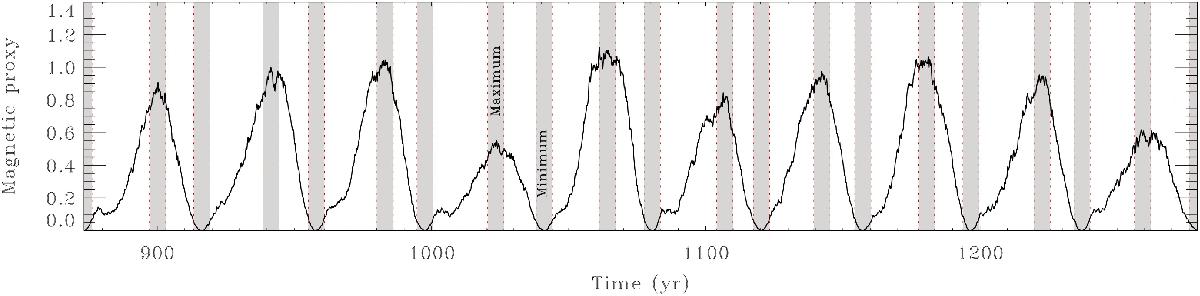
Magnetic cycle proxy (for the northern hemisphere). The vertical gray areas represent the maxima and minima phases considered. For reference we labeled these phases for simulated cycle number 24.
Current usage metrics show cumulative count of Article Views (full-text article views including HTML views, PDF and ePub downloads, according to the available data) and Abstracts Views on Vision4Press platform.
Data correspond to usage on the plateform after 2015. The current usage metrics is available 48-96 hours after online publication and is updated daily on week days.
Initial download of the metrics may take a while.