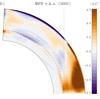
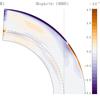
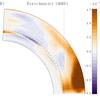
Fig. 12
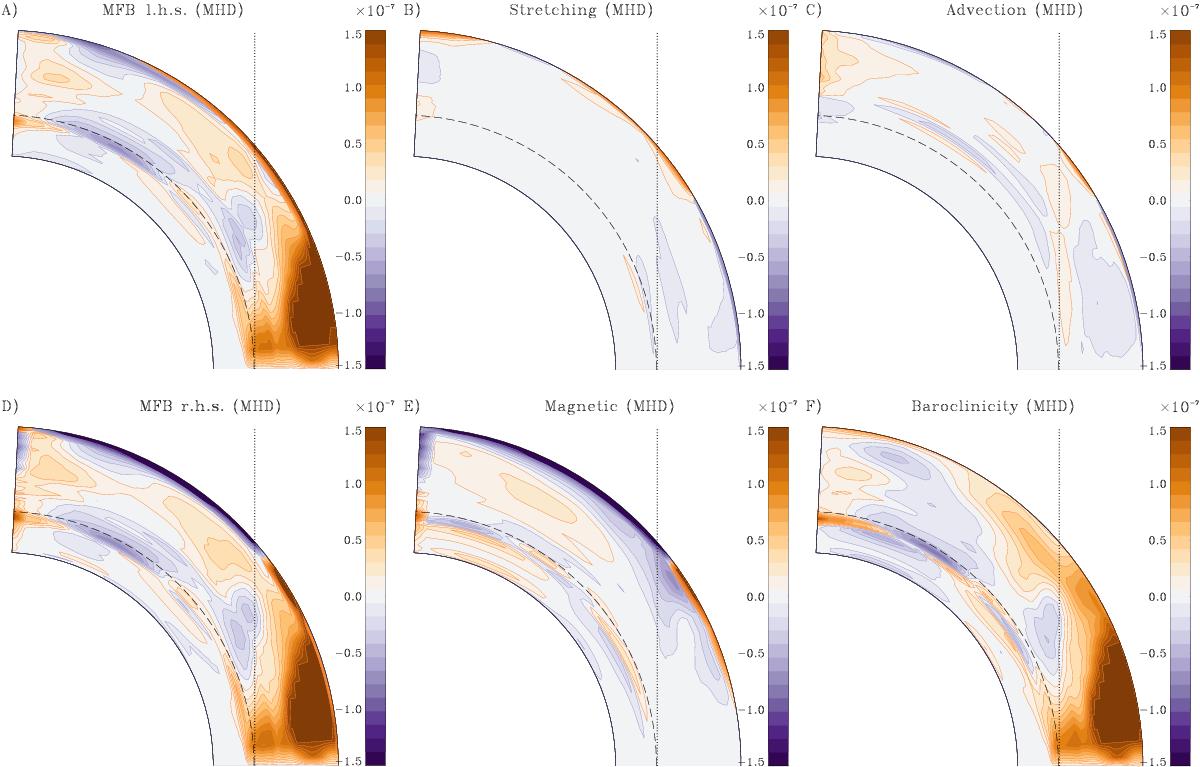
Panels A and D: left- and right-hand sides of the MFB equation in the NH for the MHD case. The individual terms of the right-hand side are shown in panels B, C, E, and F. The magnetic contribution is the sum of the two individual magnetic terms. The vertical dotted line represents the TC. The color scale saturates at ± 1.5 × 10⁻⁷ s-1.
Current usage metrics show cumulative count of Article Views (full-text article views including HTML views, PDF and ePub downloads, according to the available data) and Abstracts Views on Vision4Press platform.
Data correspond to usage on the plateform after 2015. The current usage metrics is available 48-96 hours after online publication and is updated daily on week days.
Initial download of the metrics may take a while.