Fig. 10
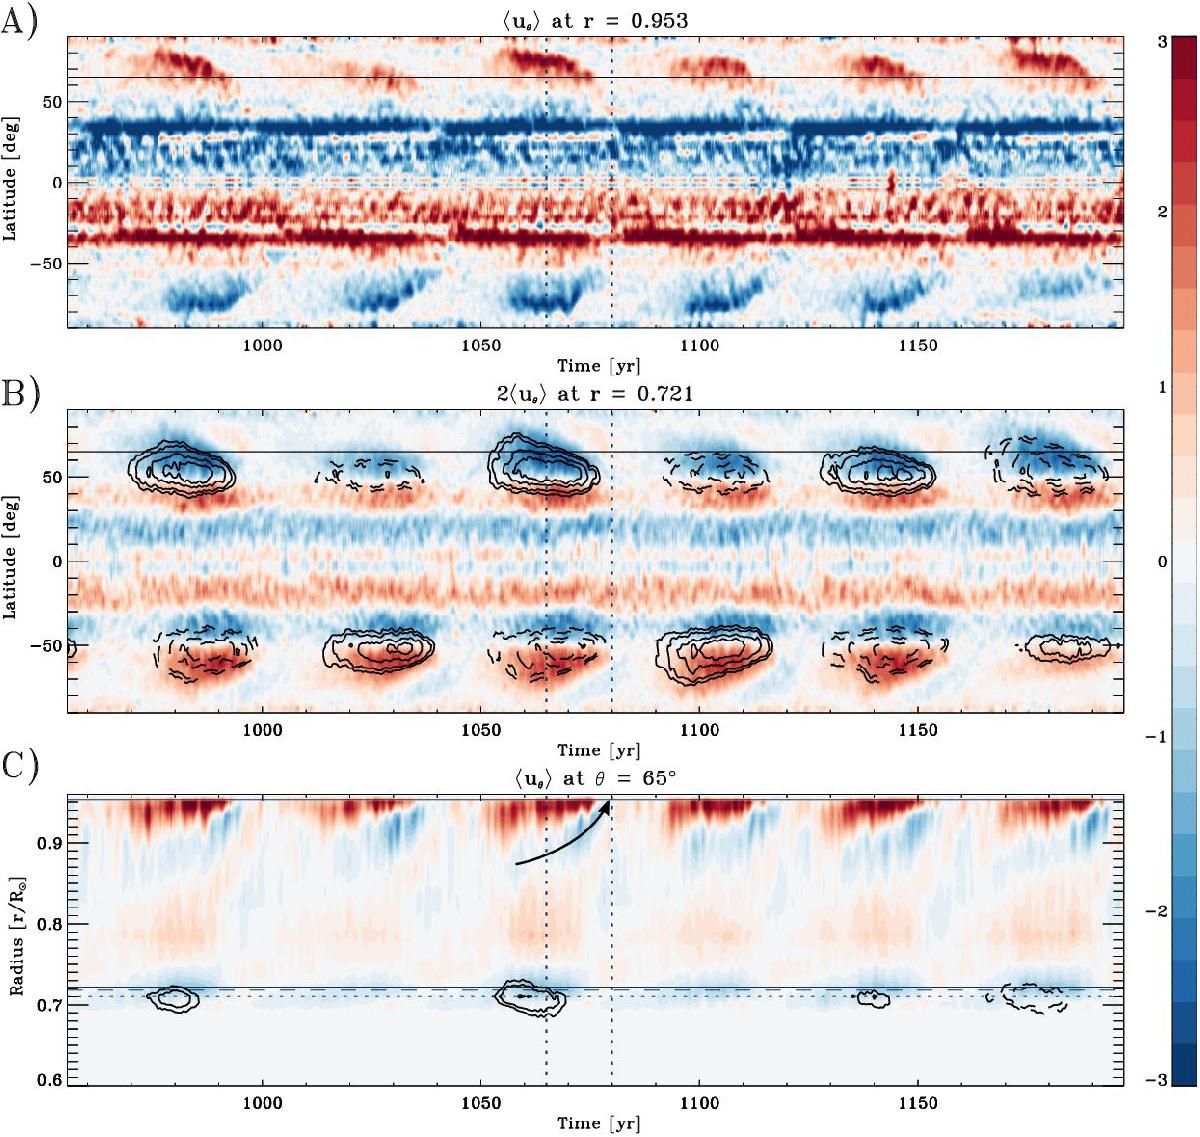
Mean latitudinal flow ⟨ uθ ⟩ as a function of latitude and time at A) the top layers (r = 0.95 R⊙) and B) near the base of the CZ (r = 0.72 R⊙). For a better contrast, in panel B the displayed quantity is actually 2⟨ uθ ⟩. The black contour lines represents ⟨ Bφ ⟩ (solid and dashed for positive and negative polarities respectively). The horizontal solid line represents the latitude at which panel C is sampled. The time interval covers cycles 23 to 28. The color scale saturates at ± 3 m s-1 (red northward, blue southward). Panel C is a radius vs. latitude plot of ⟨ uθ ⟩ taken at 65° north. Both ⟨ uθ ⟩ and ⟨ Bφ ⟩ are smoothed over 6 months. The vertical dotted lines represent the maximum and minimum of cycle 25. The dashed line marks the tachocline depth, the dotted line below it is the depth where ⟨ Bφ ⟩ contours are computed and the solid line is the depth where panel B is sampled.
Current usage metrics show cumulative count of Article Views (full-text article views including HTML views, PDF and ePub downloads, according to the available data) and Abstracts Views on Vision4Press platform.
Data correspond to usage on the plateform after 2015. The current usage metrics is available 48-96 hours after online publication and is updated daily on week days.
Initial download of the metrics may take a while.