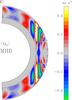
Fig. 1
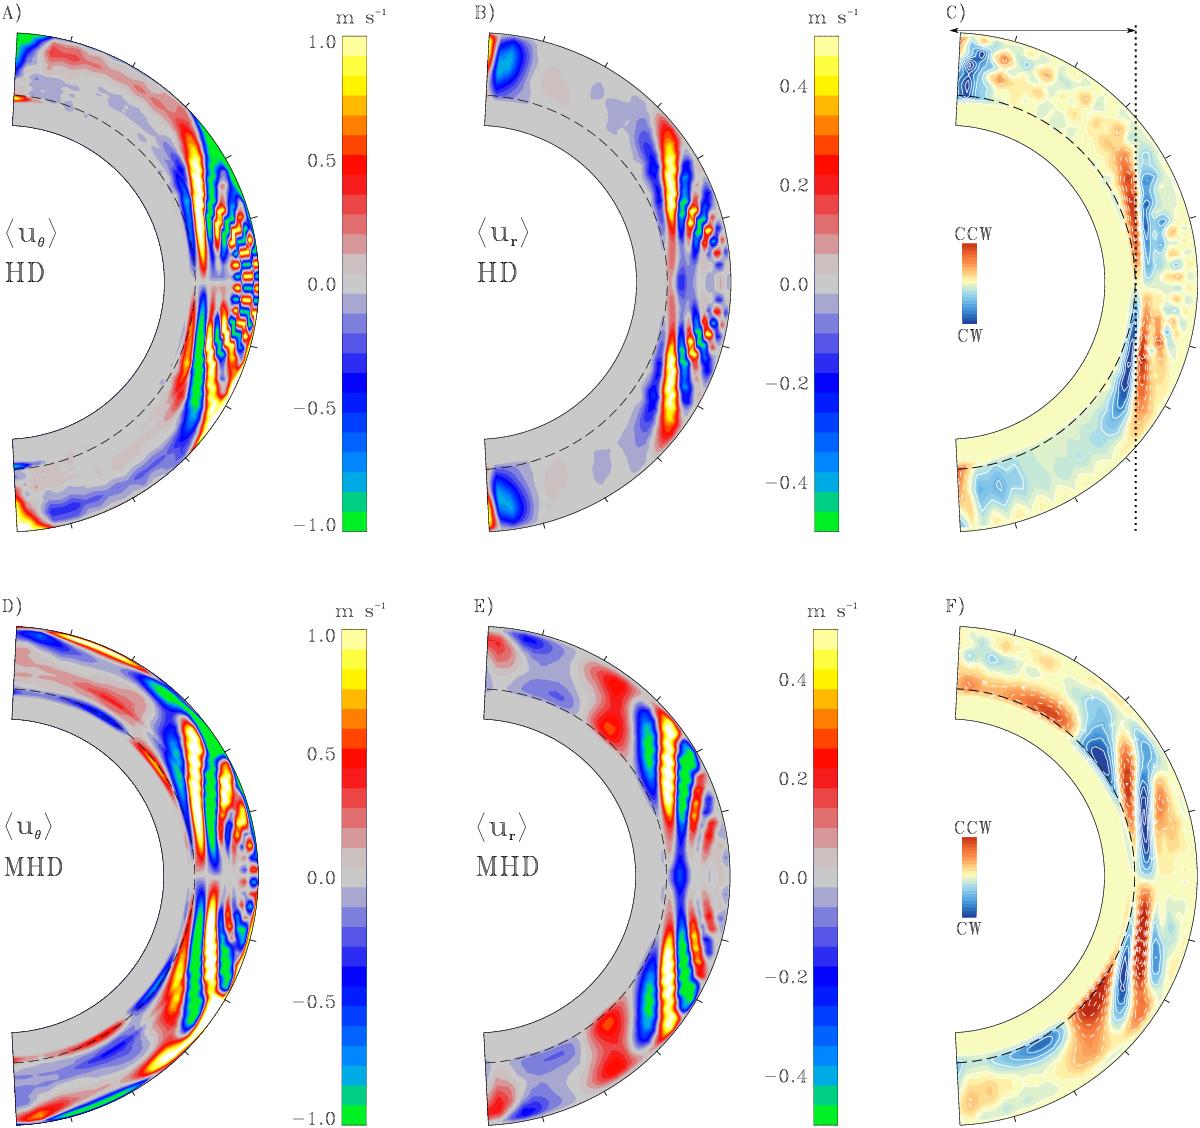
Meridional plane displays of time averaged ⟨ ur ⟩, ⟨ uθ ⟩ and stream function. The top row is for a HD simulation, while the bottom row shows the same quantities for a MHD counterpart. For the HD (MHD) case, the temporal average corresponds to 246 (406) yr. In panels A and D, red/yellow (blue/green) denotes flows towards the north (south). In panels B and E, red (blue) denotes rising (sinking) flows. In panels C and F, we present the stream lines of the MC. The red (blue) tones denotes circulation in the counterclockwise (clockwise) direction. The black dashed line indicates the depth of the base of the convection zone. Below it we have the stable layers. The vertical dotted line in C) indicates the position of the tangent cylinder for reference. At the top layer, thin ticks mark 15° intervals. Panel C can be directly compared with Fig. 1g of FM15.
Current usage metrics show cumulative count of Article Views (full-text article views including HTML views, PDF and ePub downloads, according to the available data) and Abstracts Views on Vision4Press platform.
Data correspond to usage on the plateform after 2015. The current usage metrics is available 48-96 hours after online publication and is updated daily on week days.
Initial download of the metrics may take a while.