Fig. 6
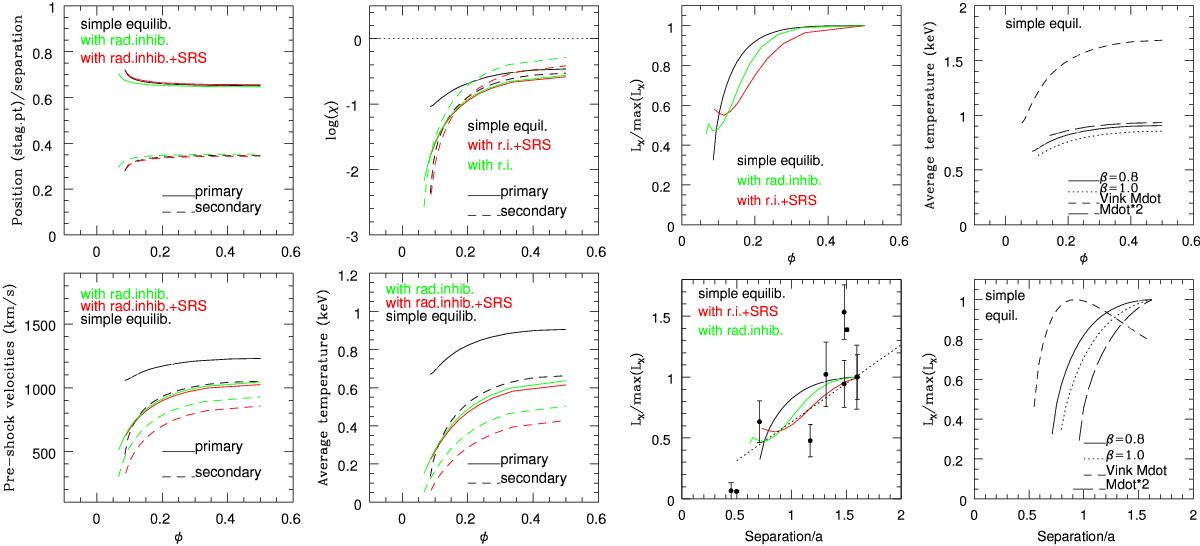
Left and middle panels: theoretical evolution with phase of the position of the stagnation point, of the pre-shock velocities, of the cooling parameter χ (the dotted line in that panel indicating the limit between radiative and adiabatic collisions), of the average post-shock temperatures (kT ~ 0.6 [v/ 1000 km s-1] 2), and of the X-ray luminosities (compared to their maximum values). Luminosities are also shown as a function of separation rather than phase. In this panel, observed fluxes in the hard band, corrected for interstellar absorption and normalized by values closest to apastron, are shown with black dots to facilitate comparison with expectations. In the same panel, the best-fit linear relation to the predicted X-ray luminosities (including radiative inhibition and SRS) is added as a dotted line to highlight the predicted trend with separation. Right panels: comparison of the temperatures (top, as a function of phase for the primary wind) and of the normalized X-ray luminosities (bottom, as function of separation) predicted for simple equilibrium using mass-loss rates from Table 1 with velocities following a β = 0.8 or 1.0 law (solid and dotted lines, respectively), using mass-loss rates derived from the recipe of Vink et al. (2000) with β = 0.8 (short dashed line), or using a mass-loss rate for the primary twice as high as that in Table 1 with β = 0.8 (long dashed line).
Current usage metrics show cumulative count of Article Views (full-text article views including HTML views, PDF and ePub downloads, according to the available data) and Abstracts Views on Vision4Press platform.
Data correspond to usage on the plateform after 2015. The current usage metrics is available 48-96 hours after online publication and is updated daily on week days.
Initial download of the metrics may take a while.