Fig. 5
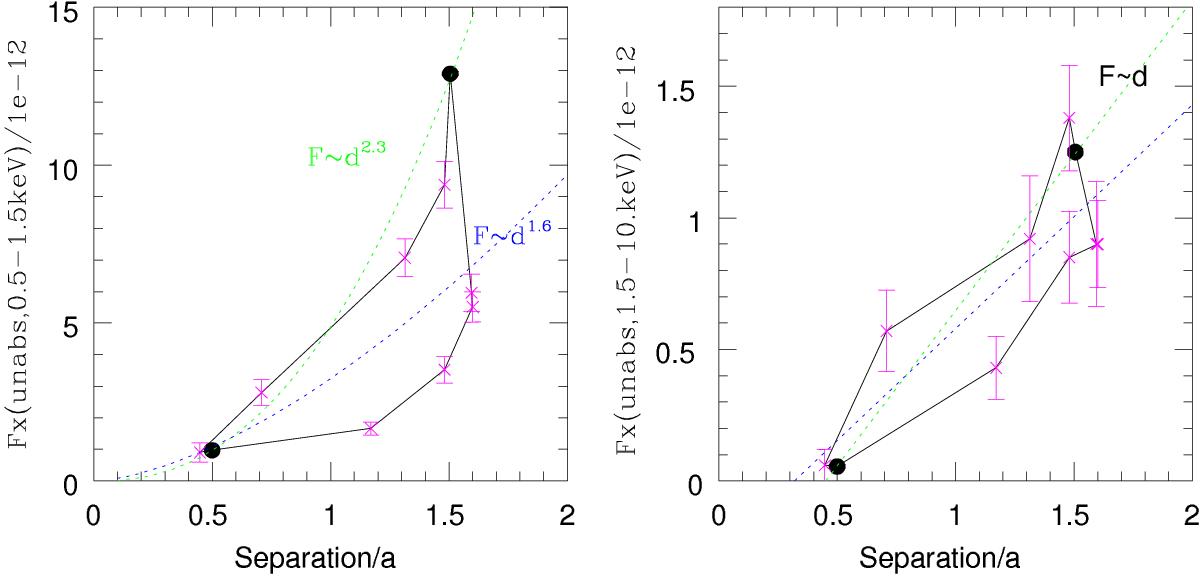
Soft (left) and hard (right) fluxes, after correction for the interstellar absorption and in units 10-12 erg cm-2 s-1, relative to the separation between the components in HD 166734 (in units of a). Swift and XMM-Newton observations are shown by magenta crosses and black filled circles, respectively. The best-fit relations are shown by dotted lines (in green when taking errors into account, so XMM-Newton data are driving the fit; in blue when all points have the same weight).
Current usage metrics show cumulative count of Article Views (full-text article views including HTML views, PDF and ePub downloads, according to the available data) and Abstracts Views on Vision4Press platform.
Data correspond to usage on the plateform after 2015. The current usage metrics is available 48-96 hours after online publication and is updated daily on week days.
Initial download of the metrics may take a while.