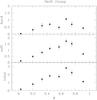
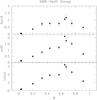
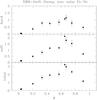
Fig. 3
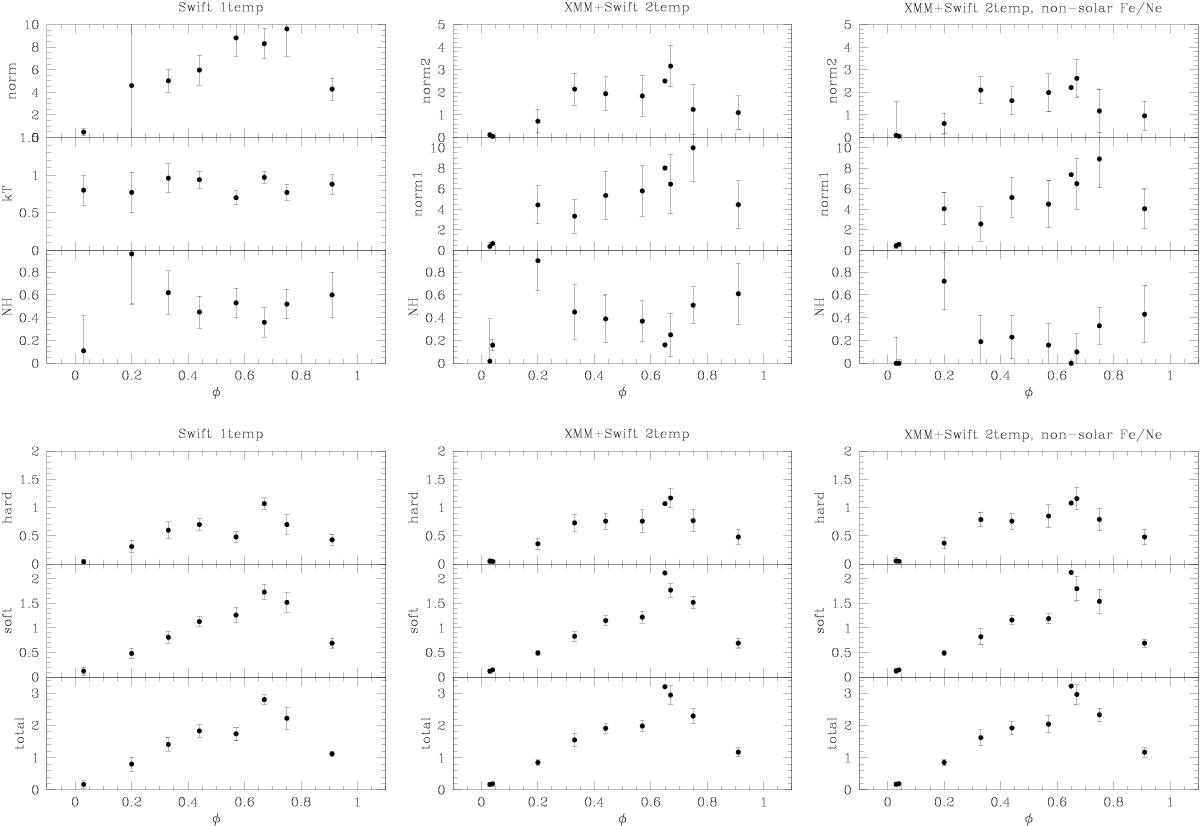
Results of the spectral fits for the three types of fits performed (Table 3). The three panels on the top line provide the variations with phase of the spectral parameters (norm in units 10-3 cm-5, kT in keV, and NH in units 1022 cm-2) while the three panels on the bottom line yield observed fluxes in units 10-12 erg cm-2 s-1. The panel pairs in the left, middle, and right columns correspond to results from single temperature fits, two-temperature fits with solar abundances, and two-temperature fits with non-solar abundances, respectively.
Current usage metrics show cumulative count of Article Views (full-text article views including HTML views, PDF and ePub downloads, according to the available data) and Abstracts Views on Vision4Press platform.
Data correspond to usage on the plateform after 2015. The current usage metrics is available 48-96 hours after online publication and is updated daily on week days.
Initial download of the metrics may take a while.